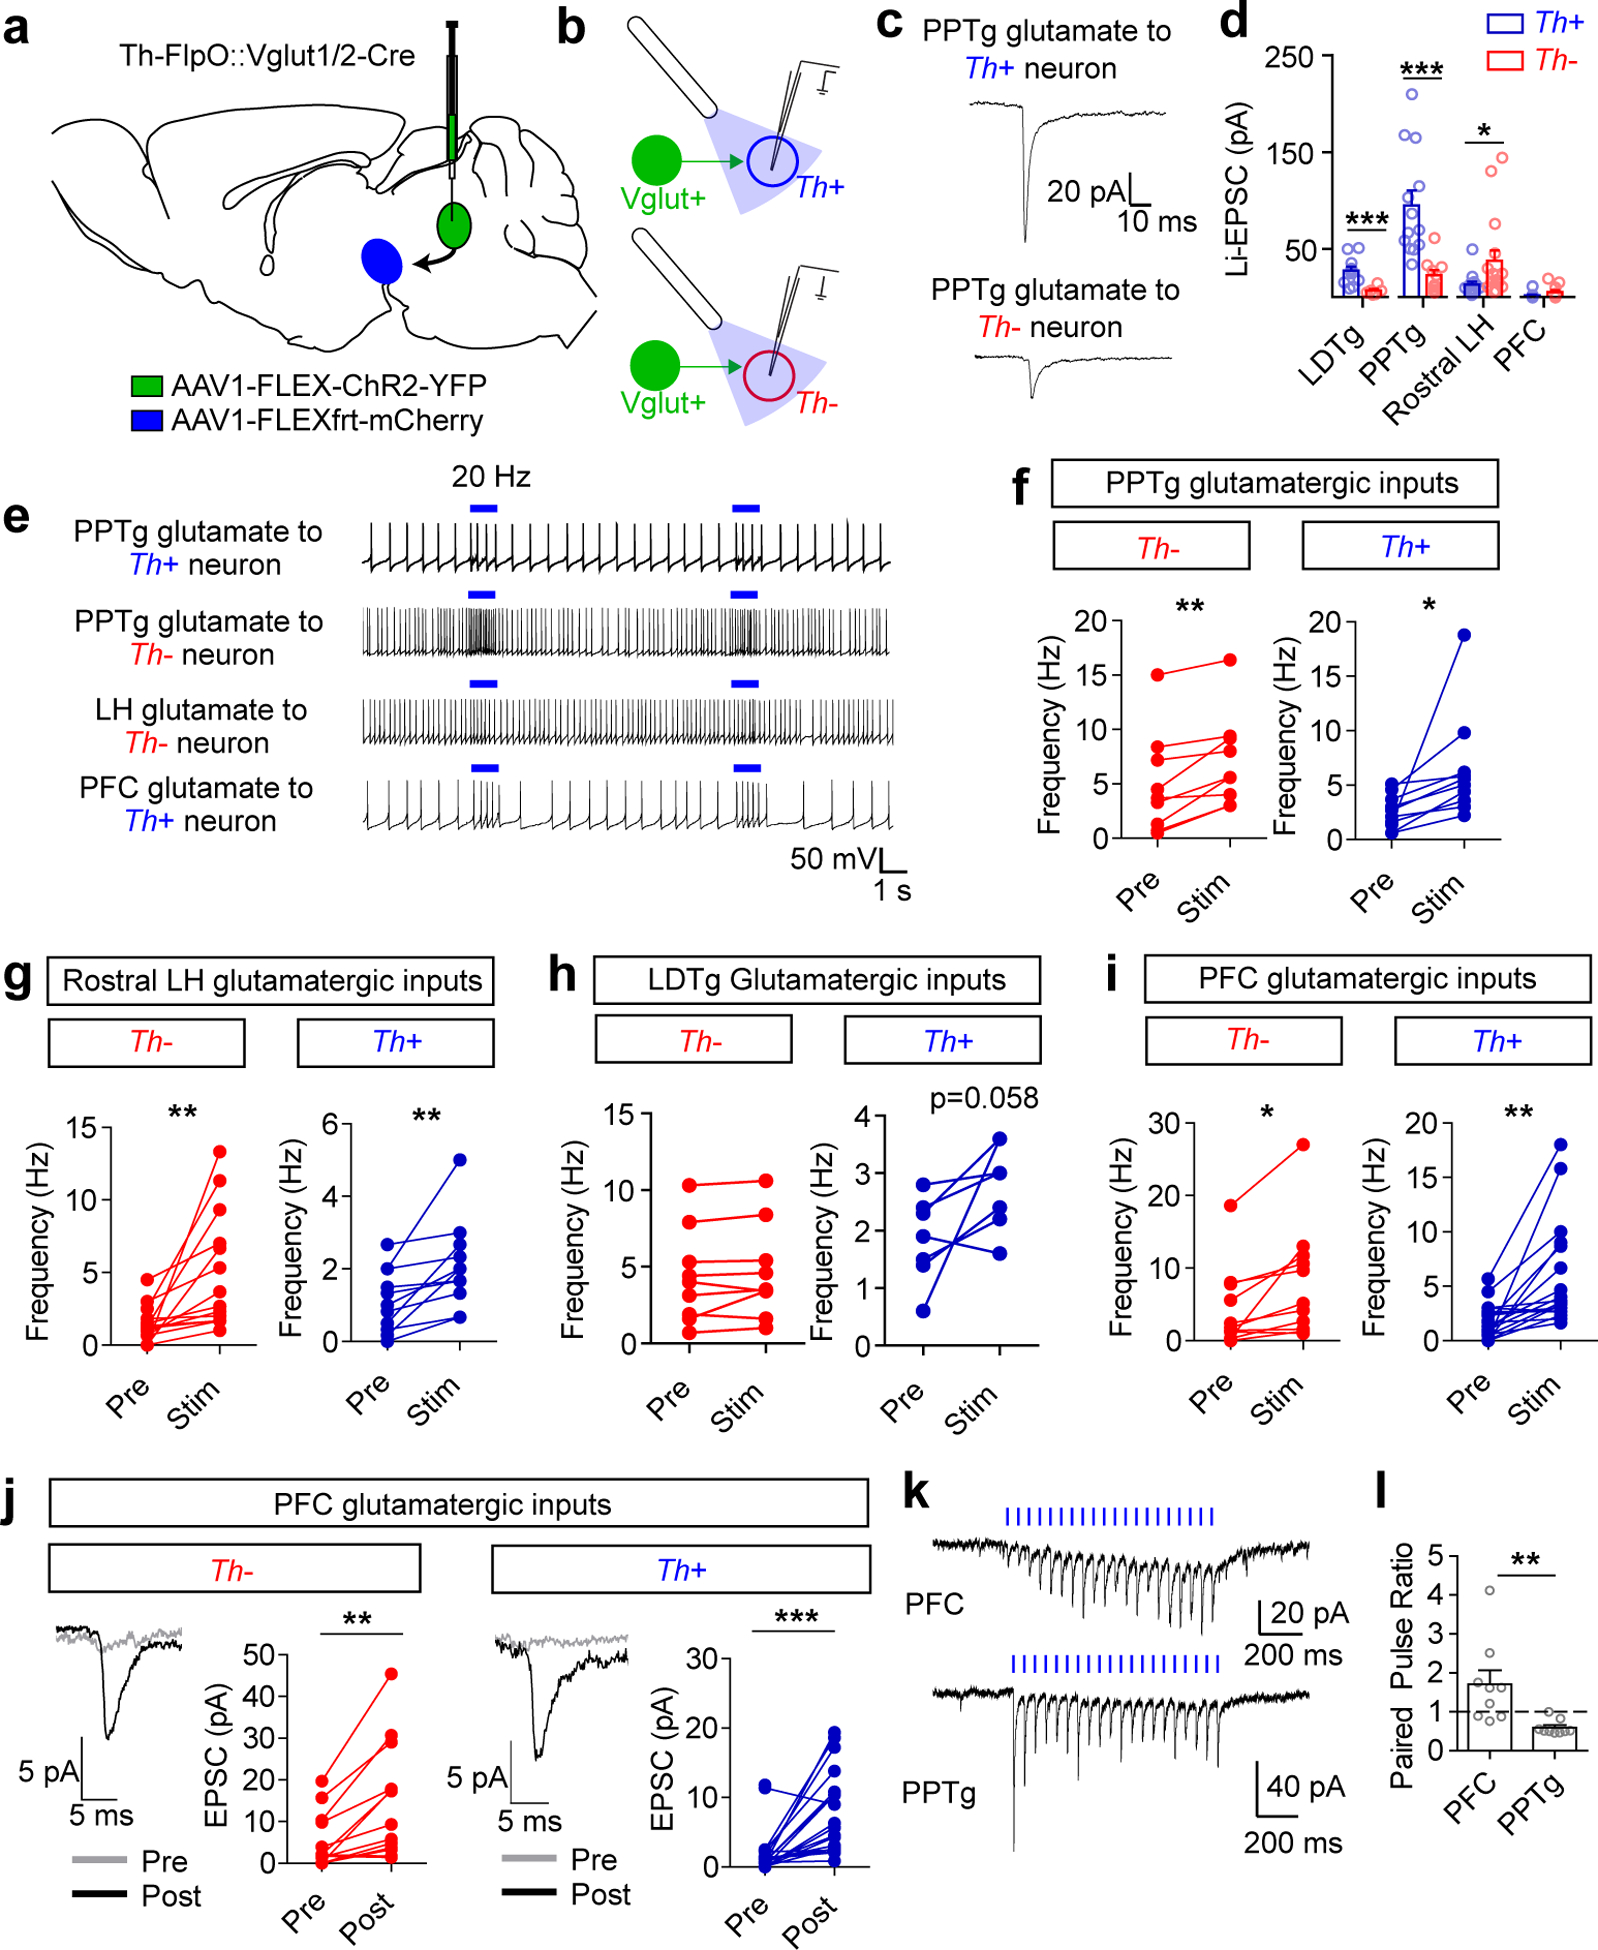
Figure 3. Connectivity of glutamatergic inputs to the VTA.

(a) Illustration of AAV1-FLEX-ChR2-YFP injection into the region of interest and AAV1-FLEXfrt-mCherry injection into the VTA in Th-FlpO::Vglut Cre mice. (b) Illustration of patch-clamp recordings from Th+ (dopamine) and Th− (non-dopamine) VTA neurons and blue light stimulation of ChR2 inputs. (c) Example traces (average of 10 sweeps) and (d) quantification of light-evoked EPSCs (Li-EPSCs) recorded from Th+ and Th− neurons in the VTA, identified by fluorescence. Only cells with a measurable connection are included here; for PFC, amplitudes are measured prior to 20 Hz stimulation (see below). See Extended Data Fig. 5 for numbers of connected vs. unconnected cells for each input. (LDTg Th+ n=11 cells, Th− n=6; PPTg Th+ n=13, Th− n=10; LH Th+ n=14, Th− n=16; PFC Th+ n=23, Th− n=18. Student’s two-tailed t testLDTg: p=0.004, PPTg: p=0.001, LH: p=0.045.) (e) Example traces of action potential firing; blue bar indicates 1 second of 20 Hz light stimulus. (f-i) Quantification of action potential frequency before and during 20 Hz light stimulation, averaged from 3 sweeps/cell. (PPTg Th− n=9 cells, Th+ n=10; LDTg Th− n=9, Th+ n=7; LH Th− n=14, Th+ n=12; PFC Th− n=11; Th+ n=18; Paired two-tailed t tests PPTg TH−: p=0.003, PPTg TH+: p=0.034, LH TH−: p=0.005, LH TH+: p=0.005, PFC TH−: p=0.011, PFC TH+: p=0.001). (j) Example traces (average of 10 sweeps) and Li-EPSC amplitudes recorded before and after 5× 1 second 20 Hz light stimulation. (Th− n=13 cells, Th+ n=23 cells, paired two-tailed t tests TH−: p=0.002, TH+: p=0.0002). (k) Example traces of Li-EPSCs from PFC and PPTg inputs evoked by 20 Hz light stimulus. (l) Paired pulse ratio (second pulse amplitude/first pulse amplitude) of Li-EPSCs from PFC and PPTg inputs (n=9 cells/group, Student’s two-tailed t test p=0.007). For all panels error bars represent s.e.m.
