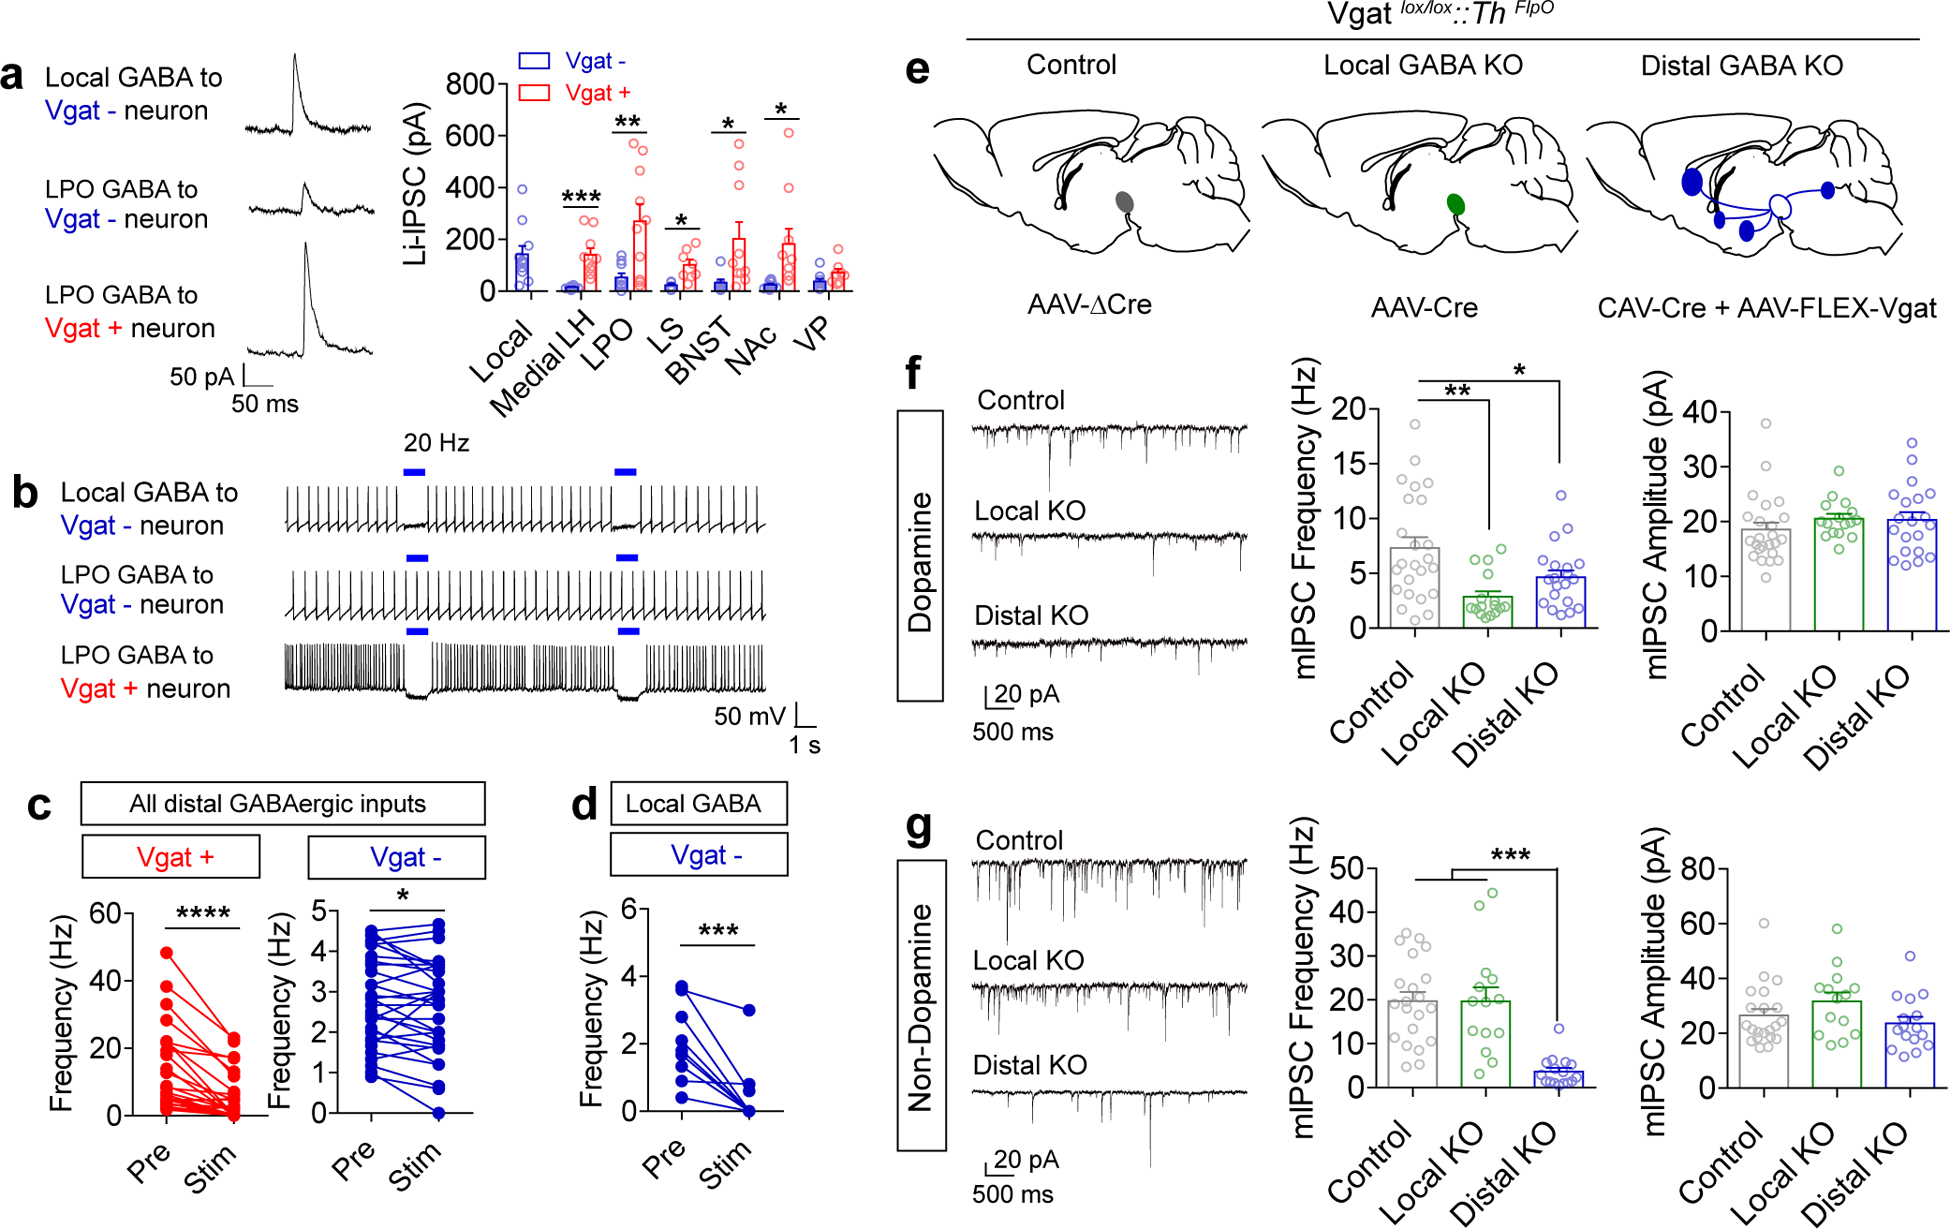
Figure 4. Connectivity of GABAergic inputs to the VTA.

(a) Example traces (average of 10 sweeps) and quantification of light-evoked IPSCs (Li-IPSCs) recorded from Vgat- and Vgat+ neurons in the VTA, identified by fluorescence. Only cells with a measureable connection are included here; see Extended Data Fig. 5 for numbers of connected vs. unconnected cells for each input (local n=11 cells; LH Vgat- n=8, Vgat+ n=10; LPO Vgat- n=10, Vgat+ n=10; LS Vgat- n=5, Vgat+ n=8; BNST Vgat- n=8, Vgat+ n=10, NAc Vgat- n=10, Vgat+ n=10; VP Vgat- n=9, Vgat+ n=8; Student’s two-tailed t test LH: p=0.0004, LPO: p=0.005, LS: p=0.011, BNST: p=0.036, NAc: p=0.016). (b) Example traces of action potential firing; blue bar indicates 1 second of 20 Hz light stimulus. (c-d) Quantification of action potential frequency before and during 20 Hz light stimulation, averaged from 3 sweeps/cell (Distal Vgat+ n=28 cells; Distal Vgat- n=33; Local n=10; paired two-tailed t tests distal Vgat+: p<0.0001, distal Vgat-: p=0.017, local Vgat-: p=0.0007). (e) Illustration of experimental groups. Vgatlox/lox::ThFlpO mice were injected in the VTA with the indicated virus(es) mixed with AAV1-FLEXfrt-mCherry to label dopamine neurons for slice recording. (f-g) Example traces and quantification of mIPSC frequency and amplitude recorded from Th+ (dopamine; f) and Th− (non-dopamine; g) neurons (Dopamine: n=24 cells control, 16 VTA KO, 20 distal KO; Non-dopamine: 21 cells control, 14 cells VTA KO, 16 cells distal KO. One-way ANOVA: Dopamine frequency F(2,57)=7.48, p=0.001, Non-dopamine frequency F(2,48)=17.31, p<0.0001; *p<0.05, **p<0.01, ***p<0.001 Tukey’s multiple comparisons). Error bars represent s.e.m.
