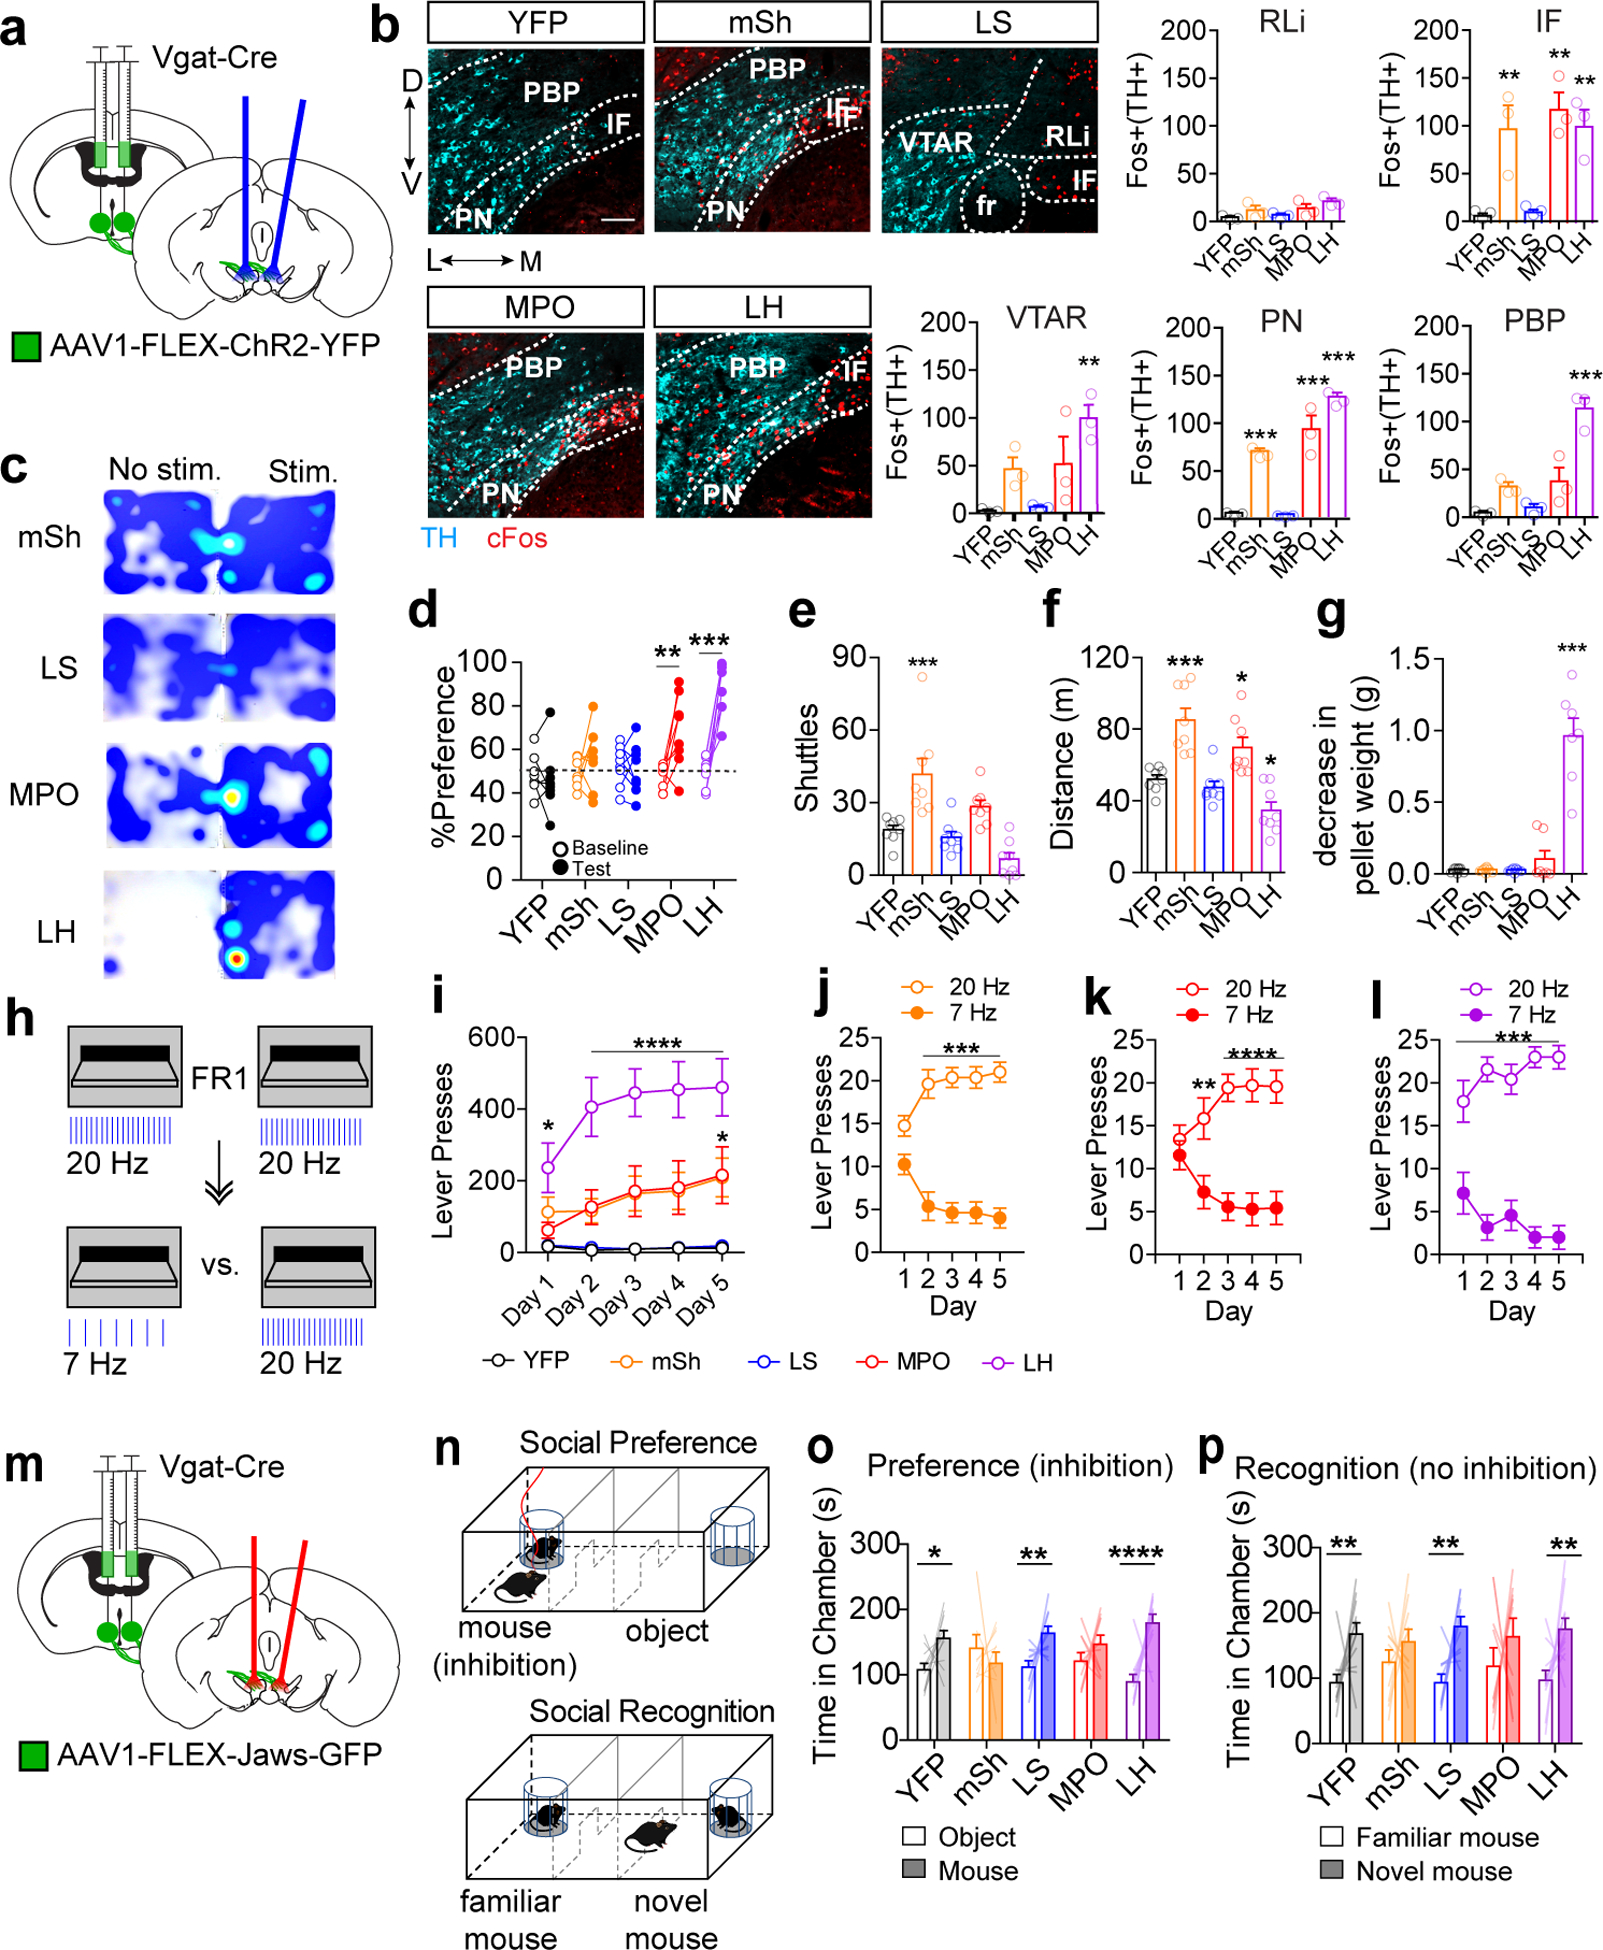
Figure 6. Optogenetic activation and inhibition of specific distal GABAergic inputs differentially affects dopamine neuron activation and dopamine-dependent behaviors.

(a) Schematic of bilateral ChR2-YFP injection into a Vgat-Cre mouse and bilateral optic fiber implantation above the VTA. (b) Example images showing staining for TH (cyan) and cFos (red) in the VTA following 20 Hz light stimulation (scale bar = 100 μm), and quantification of Fos+ TH+ cells in each VTA subregion in Vgat-Cre mice expressing YFP or ChR2-YFP in the indicated brain region (n=3 mice/group, One way ANOVA VTAR:F(4,10)=6.644, p=0.007, IF: F(4,10)=10.72, p=0.001, PN: F(4,10)=62.98, p<0.0001, PBP: F(4,10)=25.87, p<0.0001, Dunnett’s two-tailed selected comparisons vs. YFP **p<0.01, ***p<0.001). (c) Example heat plots showing time spent in No Stim. vs. Stim side of the RTPP arena. (d) Percent of time spent in paired chamber during 10 min baseline pretest or during 20 min light paired session (n=8 mice/group, 2-way RM ANOVA F(4,35)=11.56, p<0.0001, Bonferroni multiple comparisons **p<0.01, ***p<0.001). (e) Number of shuttles between unpaired and paired chamber during light paired session (n=8 mice/group, One way ANOVA F(4,35)=13.69, p<0.0001, Dunnett’s two-tailed selected comparisons vs. YFP ***p<0.001). (f) Distance traveled during light paired session (n=8 mice/group, One way ANOVA F(4,35)=17.47, p<0.0001, Dunnett’s two-tailed selected comparisons vs. YFP *p<0.05,***p<0.001).(g) Decrease in food pellet weight placed into empty cage with each mouse following 20 min of 20 Hz stim (n=8 mice for YFP and mSh, 7 mice for LS, MPO, and LH; One way ANOVA F(4,32)=48.93, p<0.0001, Dunnett’s two-tailed selected comparisons vs. YFP ***p<0.001). (h) Schematic of lever pressing for light stimulation. Mice received five days of FR1 training in which either lever delivered 20 Hz stimulation, followed by 5 days of training in which their preferred lever was switched to 7 Hz stimulation. (i) Number of lever presses per one hour session during 20 Hz acquisition phase (n=8 for YFP, mSh, and LS, n=7 for MPO and LH, 2-way RM ANOVA F(16,132)=7.80, p<0.0001, Bonferroni multiple comparisons *p<0.05, ****p<0.0001 vs. YFP). (j-l) Lever presses on high or low frequency levers (25 trials) for mSh, MPO, and LH mice (n=8 for mSh, n=7 for MPO and LH; 2-way RM ANOVA mSh F(4,56)=17.81 p<0.0001, MPO F(4,48)=18.09 p<0.0001, LH F(4,48)=6.34 p=0.0004, Bonferroni multiple comparisons **p<0.01, ***p<0.001, ****p<0.0001). (m) Schematic of bilateral Jaws-GFP injection into a Vgat-Cre mouse and bilateral optic fiber implantation above the VTA. (n) Schematic of social preference and social recognition assays. Mice received red light stimulation when in the mouse chamber during the preference assay. (o) Time spent in the mouse or object chamber during the five-minute trial period (n=11 mice for YFP and LH, n=10 mice for mSh, LS, and MPO, Two-way ANOVA Interaction F(4,94)=4.76, p=0.002; mouse vs. object: YFP *p<0.05; LS **p<0.01, LH ****P<0.0001, Fisher’s two-tailed single comparisons). (p) Time spent in the novel or familiar mouse chamber during the five-minute trial period (n=11 mice for YFP and LH, n=10 mice for mSh, LS, and MPO, Two-way ANOVA Chamber F(1,94)=26.99, p<0.0001; novel mouse vs. familiar mouse: YFP **p<0.01; LS **p<0.01, LH **p<0.01, Fisher’s two-tailed single comparisons). Error bars represent s.e.m.
