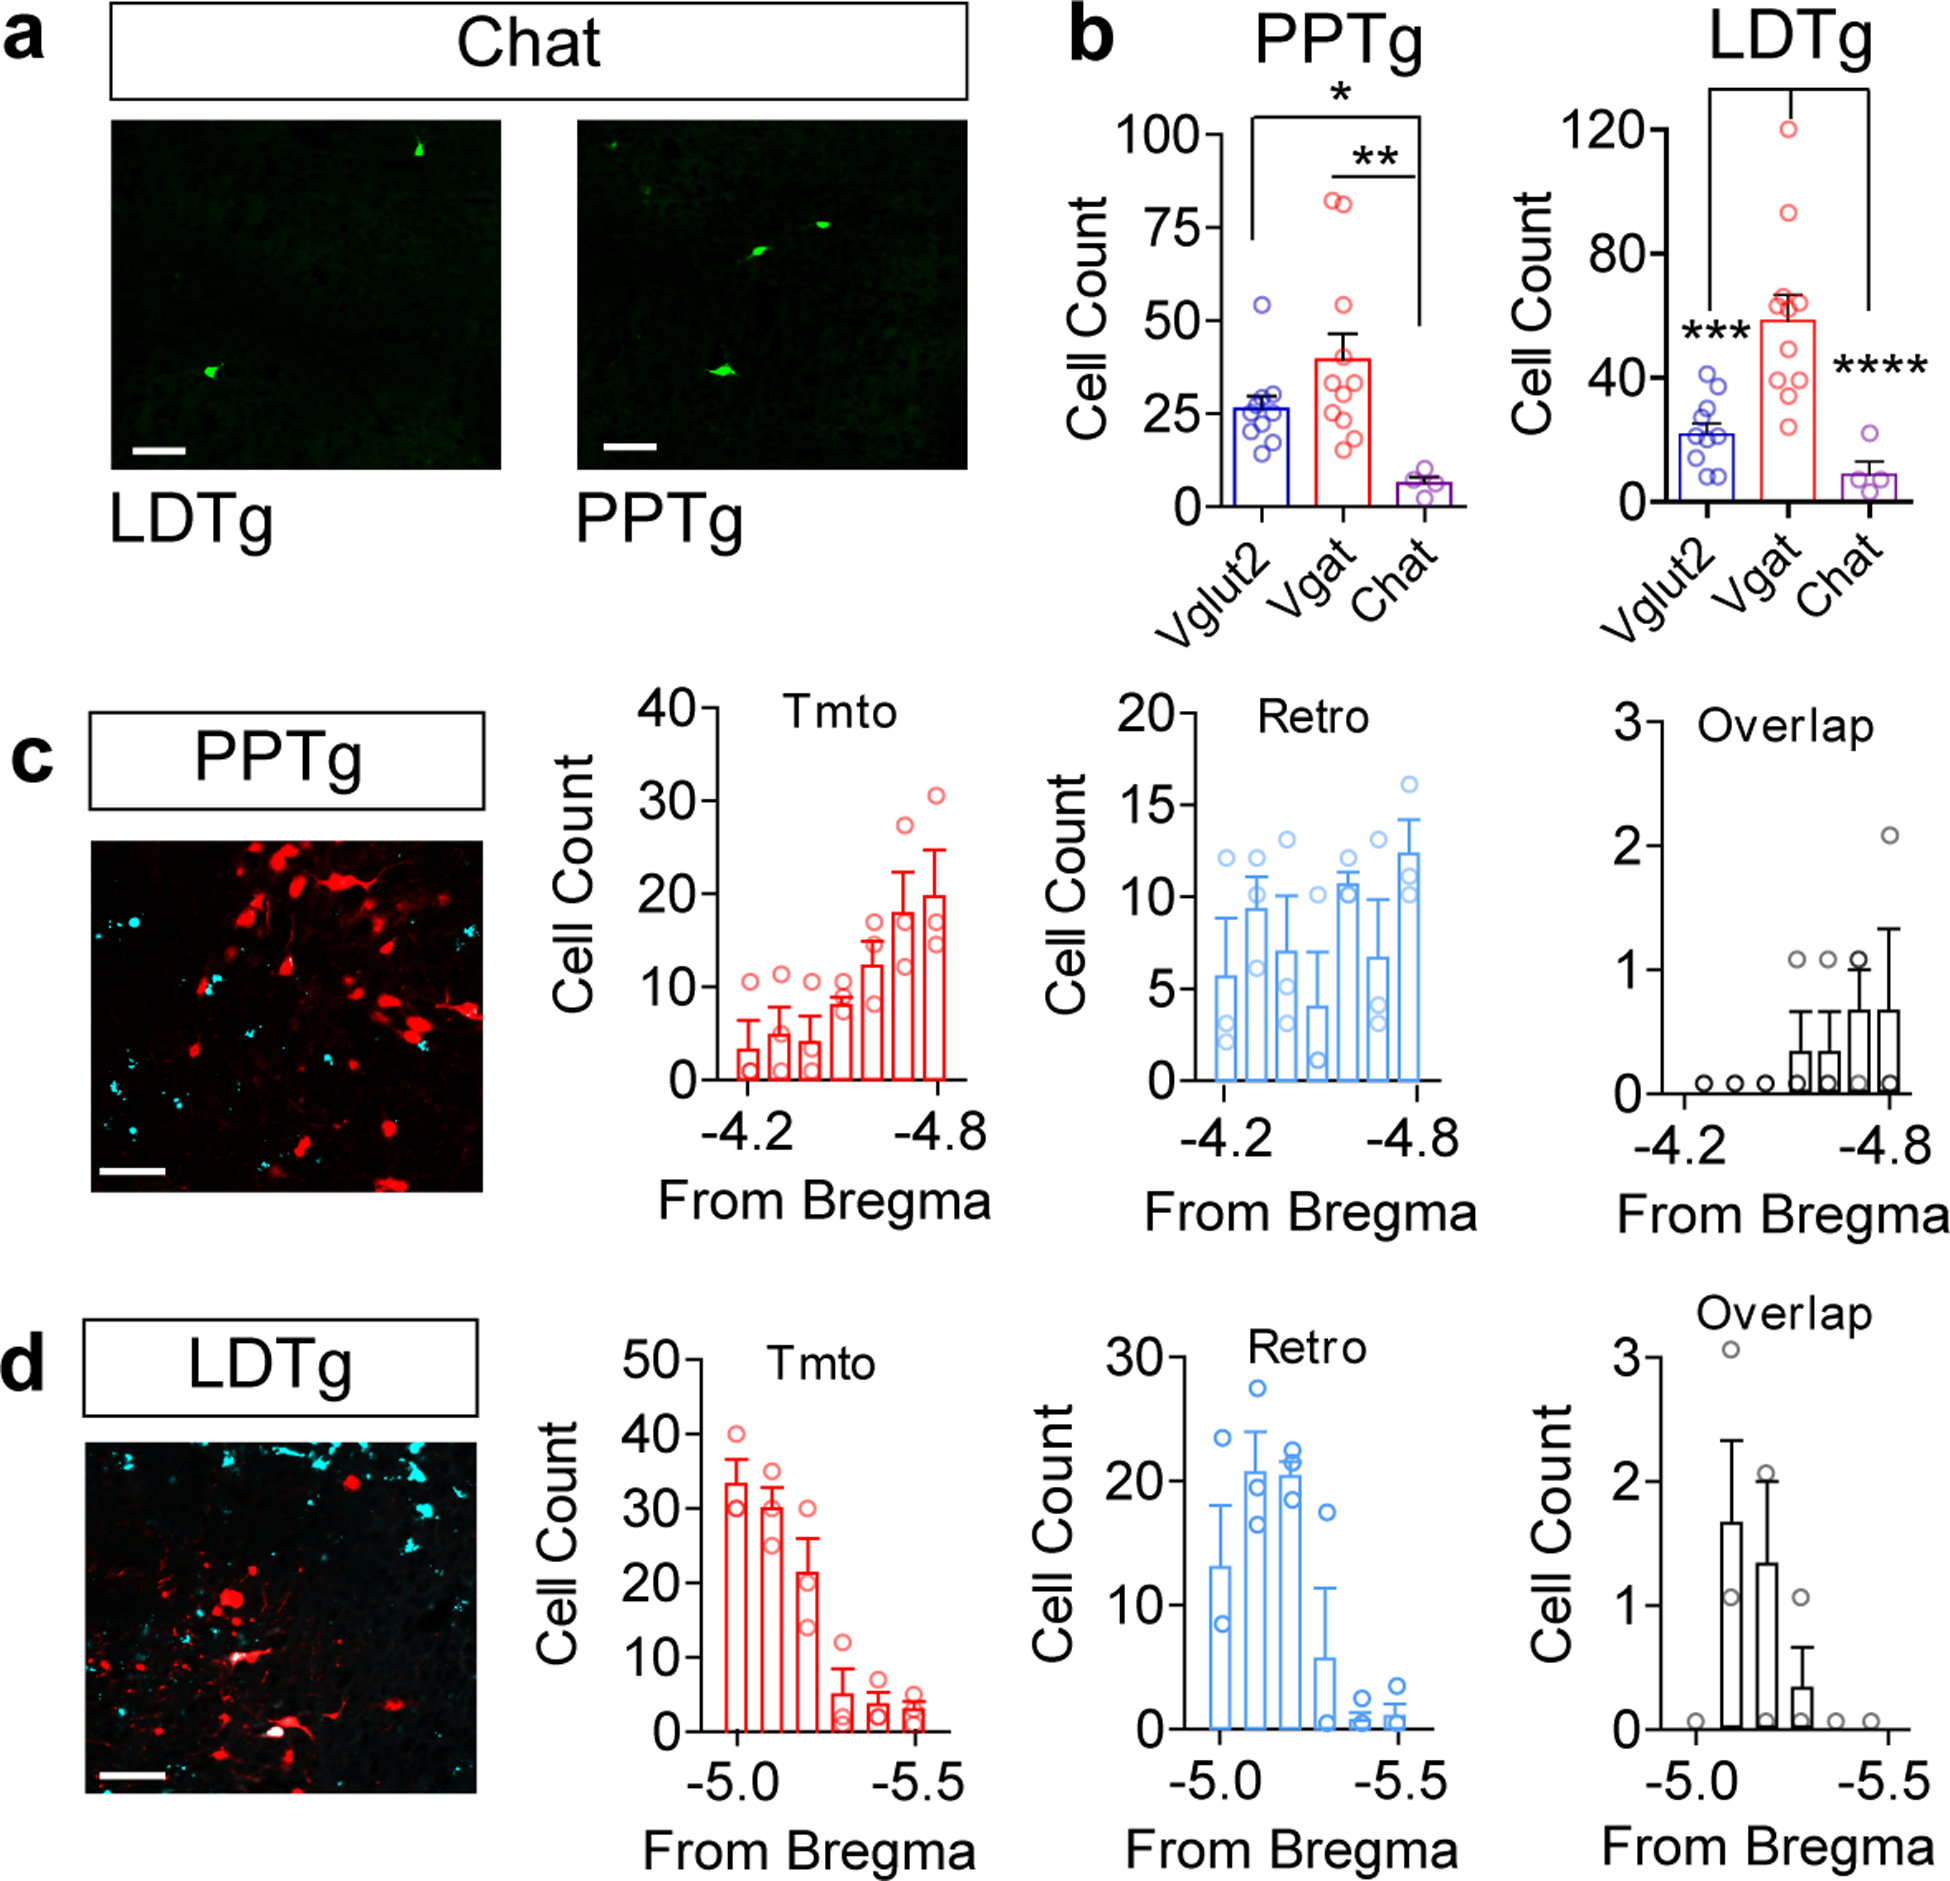
Extended Data Fig. 2. Retrobead labeling of cholinergic neurons in the PPTg and LDTg.

(a) Representative image of CAV2-FLEX-zsGreen retrogradely labeled cells in the PPTg and LDTg of a Chat Cre mouse. (b) Total cells labeled in the PPTg and LDTg in different Cre driver lines (Vglut2 n=10, Vgat n=11, Chat n=4; PPTg, One-way ANOVA, F(2,28)=7.740, P=0.0023, *P<0.05, **P<0.01; LDTg, One-way ANOVA, F(2,28)=17.41, P<0.0001, ***P<0.01, ****P<0.0001). (c-d) Representative images of Chat Cre:Tomato cells (red) and RetroBeads from the VTA (cyan) in the PPTg and LDTg, and quantification of cell counts and overlap across the rostral-caudal axis (n=3/group). Error bars represent s.e.m. Scale bars = 50μm.
