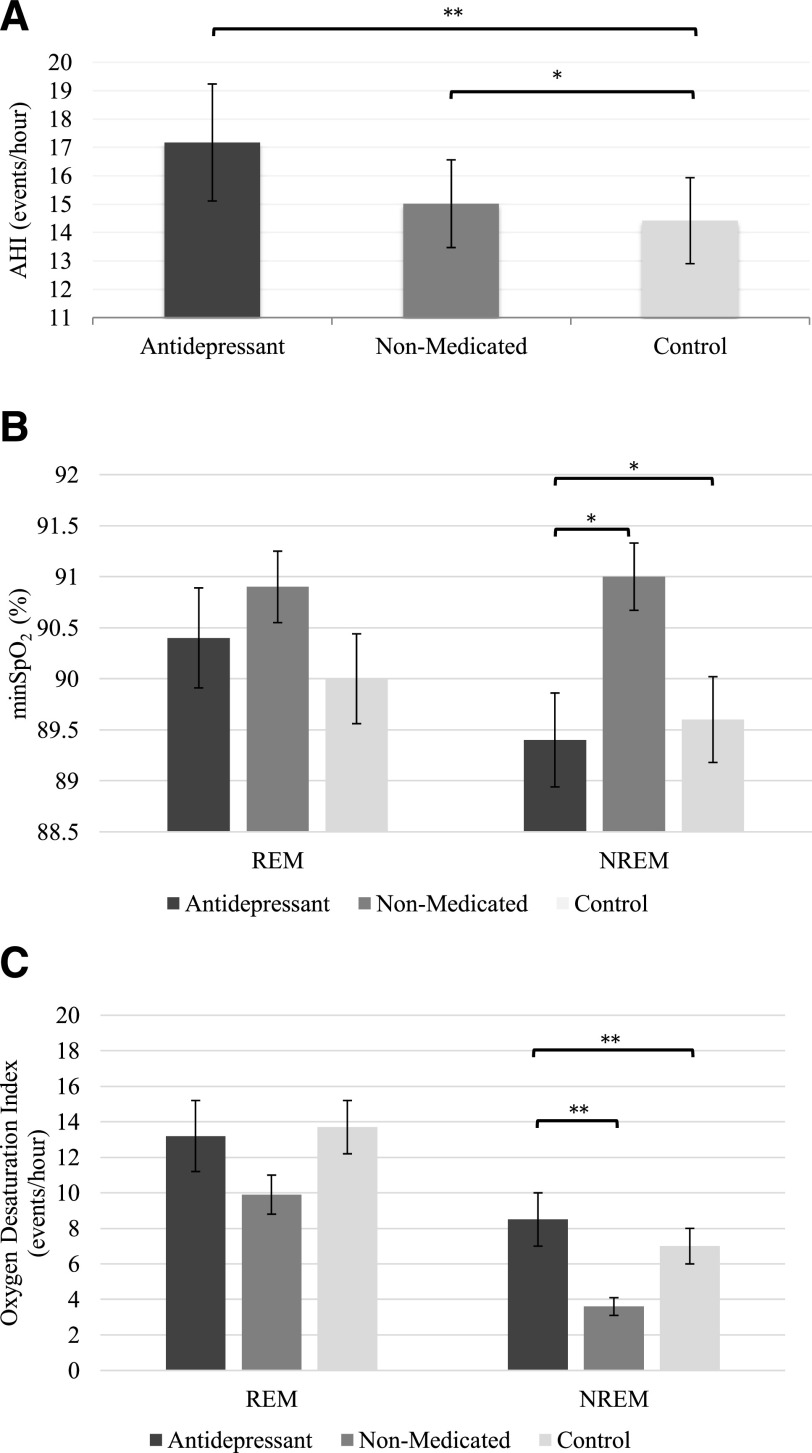
Figure 2. Respiratory parameters in the main groups.
(A) AHI (REM and NREM sleep combined), (B) minSpO2, and (C) ODI across REM and NREM sleep. Bars indicate unadjusted mean and error bars indicate the standard errors of the mean. *P ≤ .009, **P ≤ .001. There was no REM sleep noted in 8 individuals in the antidepressant group and 1 in the non-medicated group. Analyses were adjusted for age, sex, and BMI.

