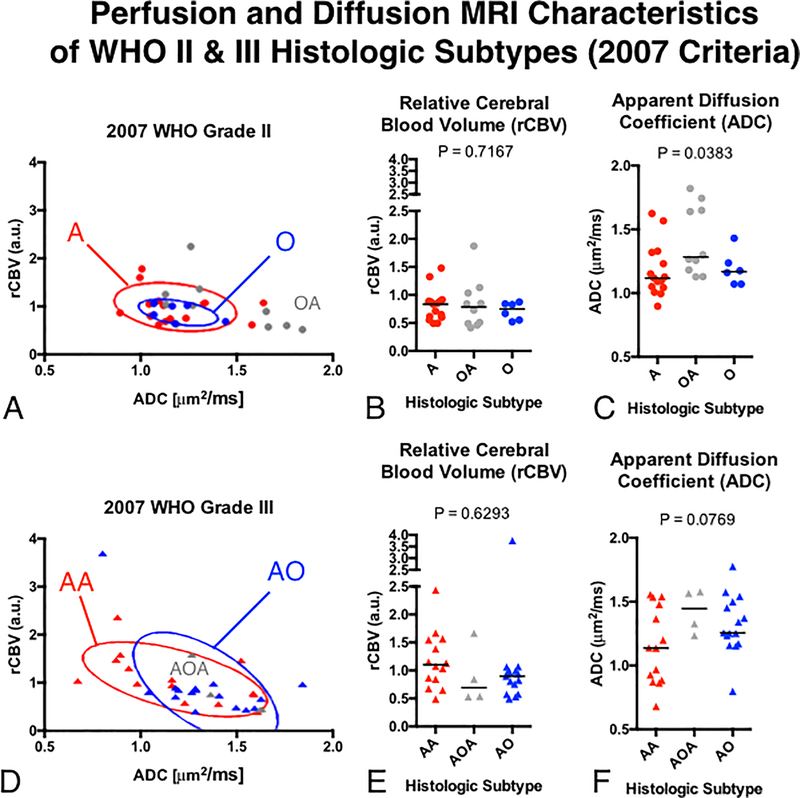
Fig 2. Comparisons of rCBV and ADC between histologic subtypes of WHO grade II and III gliomas using the 2007 WHO classification.
A) Scatter plot of median rCBV and ADC for populations of grade II glioma subtypes with elliptical error bars. B) Comparison of rCBV between grade II gliomas. C) Comparison of ADC between grade II gliomas. D) Scatter plot of median rCBV and ADC for populations of grade III glioma subtypes with elliptical error bars. E) Comparison of rCBV between grade III gliomas. F) Comparison of ADC between grade III gliomas.

