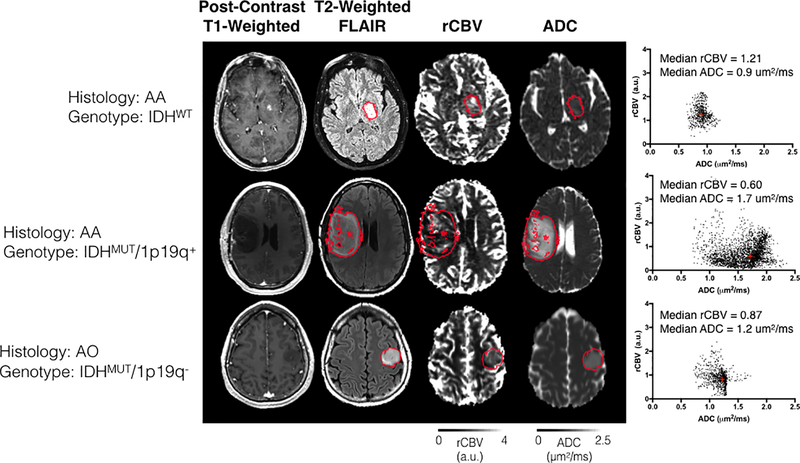
Fig 4. Imaging features extracted from three representative patients with different histologic and genetic subtypes.
Post-contrast T1-weighted anatomical, T2-weighted FLAIR anatomical, rCBV, and ADC maps are shown. The scatter plot shown on the right illustrates voxel-wise plots of rCBV versus ADC within the red region of interest outlining the T2 hyperintense lesion. Top Row: A patient with an AA subsequently characterized as IDHWT exhibited relatively high rCBV and low ADC. Middle Row: An AA patient subsequently characterized as IDHMUT/1p19q+ exhibiting a low rCBV and high ADC. Bottom Row: An AO oligodendroglioma characterized as IDHMUT/1p19q- exhibiting intermediary rCBV and ADC characteristics. (AA = Anaplastic Astrocytoma; AO = Anaplastic Oligodendroglioma).

