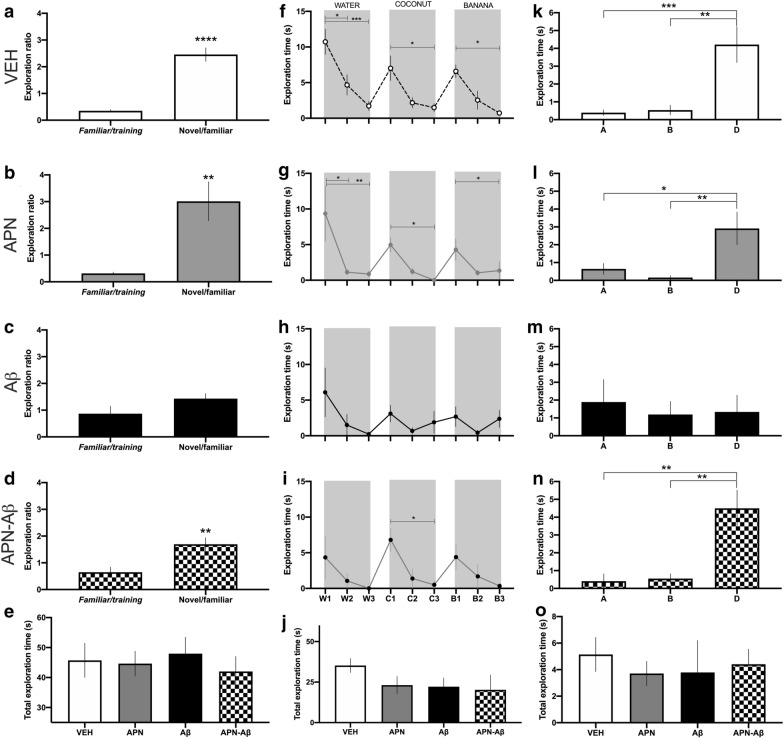
Fig. 1.
Olfactory memory and discrimination tests. Social recognition test: a exploration time in the social recognition test of vehicle group (VEH), b adiponectin and vehicle group (APN), c vehicle and Aβ (Aβ) and d adiponectin Aβ1–42 (APN–Aβ). The first bar denotes the exploration ratio between the juvenile 1 familiar/training and the second bar shows the exploration ratio between the novel/familiar, e total exploration time of both cages during the habituation trial (F[8, 63] = 8.277, p < 0.0001). Habituation–dishabituation test: time smelling a cassette with different essences for f VEH (F[8, 63] = 8.277, p < 0.0001), g APN (F[8, 34] = 3.843, p < 0.0026), h Aβ (F[8, 54] = 1.354, p < 0.2377, and i APN–Aβ (F[8, 35] = 2.346, p < 0.0391), W1-3 corresponds to the three trials where the cassette was loaded with 50 µl of water; C1-3 with 50 µl of coconut extract; and B1-3 50 µl of banana extract, j total exploration time for all of the essences and water (F[3, 19] = 1.455, p < 0.2584). Block test: time exploring each block for the groups k VEH (F[2, 18] = 12.66, p < 0.0004), l APN (F[2, 15] = 6.866, p < 0.0076), m Aβ (F[2, 15] = 0.1347, p < 0.8750) and n APN–Aβ (F[2, 21] = 12.68, p < 0.0002). First and second bars represent the time spent smelling two blocks that were placed in their own cage the night before. The third bar represents the time animals spent smelling a block from the cage of a different animal. o Total exploration time of the three blocks (F[3, 23] = 0.1752 p < 0.9121). Data are presented as SEM and evaluated using a Student’s T test (a–d) or a One-way ANOVA with a post-hoc Tukey test (e–o). Asterisks represent significance (*p < 0.05, **p < 0.001)

