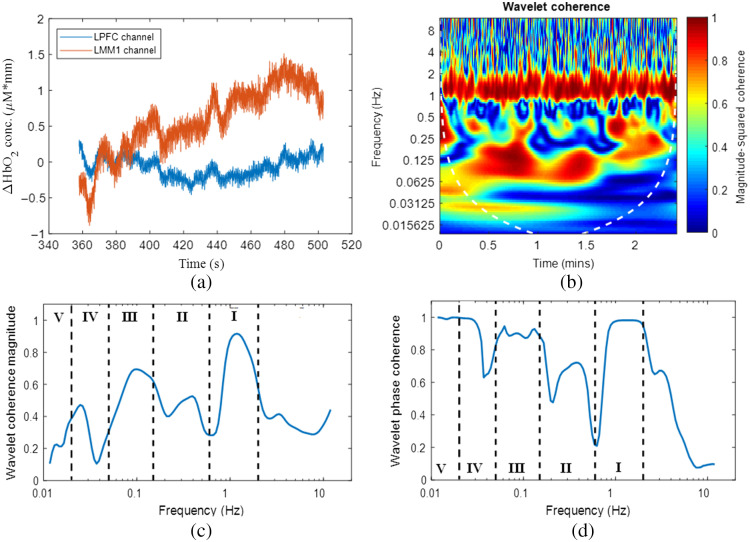
Fig. 1.
An illustrative example of WCO between two different fNIRS time-series data. (a) Timeseries data from the left lateral PFC (LPFC) and left medial M1 (LMM1) channels for a surgical expert during one FLS task trial. (b) WCO magnitude between the two time-series data in time and frequency domains. WCO magnitude values are shown via the color bar. Only values within the cone of influence range, indicated by a dashed white line, are included for WCO power magnitude and phase coherence calculations. (c) Time-averaged WCO magnitudes and (d) WPCO magnitudes between the two example time series shown in (a).

