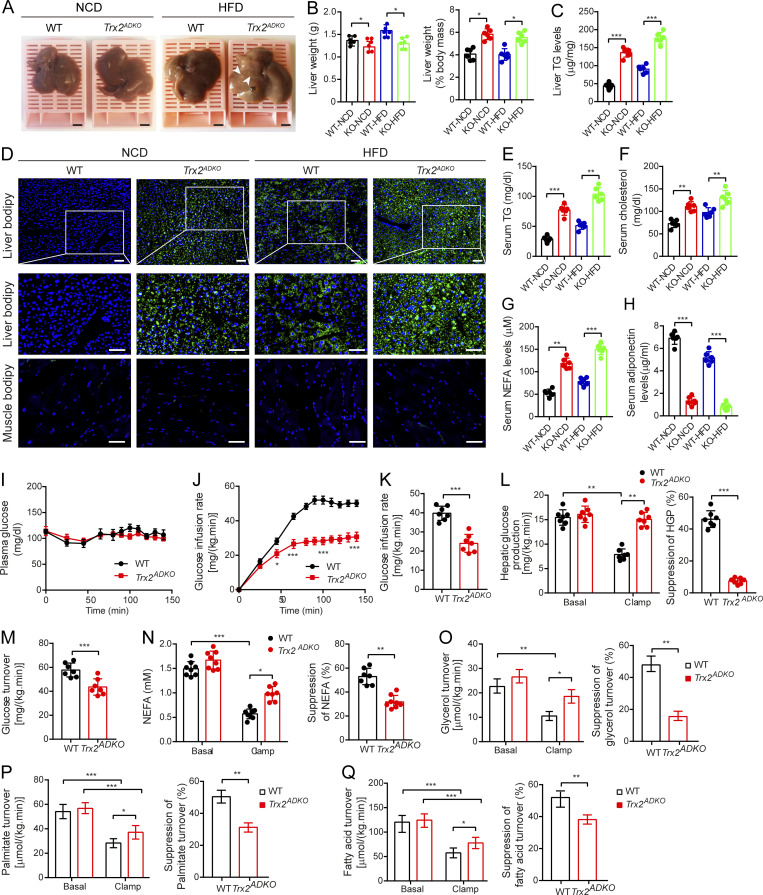
Figure 3.
Adipocyte-specific Trx2 KO promotes hepatic steatosis and hepatic insulin resistance. (A) Representative photograph of livers from 14-wk-old male WT and Trx2ADKO mice fed the NCD or HFD for 8 wk (n = 6). Arrowheads indicate visible lipid deposition. Scale bars, 2 mm. (B) Liver weight and liver weight to body weight ratios of WT and Trx2ADKO mice (KO) mice. (C) Liver TG content of mice. (D) Representative images of BODIPY staining of liver and quadriceps muscle from 14-wk-old male WT and Trx2ADKO mice fed the HFD for 8 wk (n = 6). Squares correspond to the magnified areas (middle panel). Scale bars, 50 µm. (E–H) Serum concentration of TG (E), cholesterol (F), NEFA (G), and adiponectin (H) in WT and Trx2ADKO mice (n = 6). (I–Q) The hyperinsulinemic-euglycemic clamp study from WT and Trx2ADKO mice (n = 7). (I) A steady plasma glucose is shown. (J) Levels of glucose after external infusion. (K) Glucose infusion rate required to maintain euglycemia during the final 40 min of the clamp. (L) Hepatic glucose production and suppression of HGP under basal and insulin-stimulated (clamp) conditions. (M) Insulin-stimulated whole-body glucose uptake. (N) Plasma NEFA concentrations and suppression of NEFA under basal and insulin-stimulated (clamp) conditions. (O–Q) Lipolysis with decreased suppression of glycerol, palmitate, and fatty acid turnover under basal and insulin-stimulated (clamp) conditions. Quantitative data are shown as mean ± SEM. *, P < 0.05; **, P < 0.01; ***, P < 0.001 versus the indicated comparisons. Significance was established using one-way ANOVA followed Tukey’s post hoc test (B, C, and E–H) and two-tailed Student's t test (I–Q).

