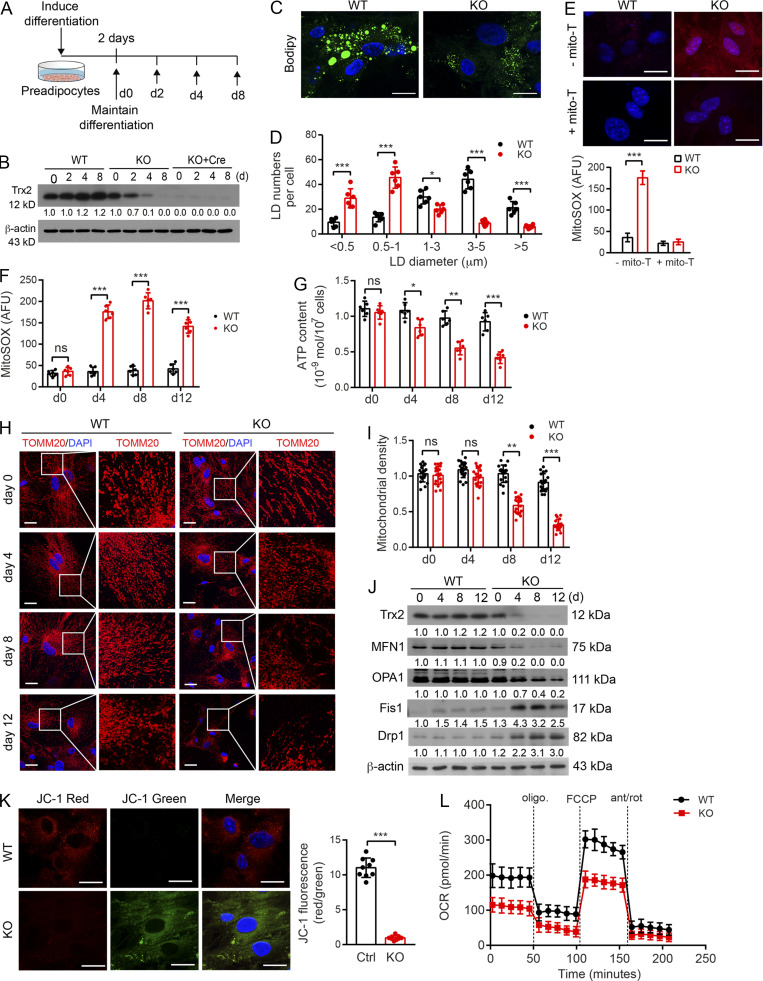
Figure S4.
Trx2 deficiency increases ROS in isolated adipocytes and alters mitochondrial energetics and oxidative metabolism. (A–D) TRX2 deficiency reduces lipogenesis during preadipocytes differentiation. (A) Differentiation scheme of preadipocytes isolated from eWAT of WT (Trx2lox/lox) and Trx2ADKO (KO) mice. (B) Representative Western blots confirming a decrease of TRX2 expression in Trx2ADKO adipocytes during differentiation upon Adipo-Cre was activated on day 4. Adeno-Cre infection rapidly induced Trx2 deletion. Protein levels were quantified and are presented as fold changes by taking WT as 1.0. n = 3. (C and D) Representative BODIPY staining images of WT and KO differentiated adipocytes at day 8 (C) and LD sizes (D) from six random fields were quantified (n = 3 biological repeats). (E) Representative micrographs of mitochondrial ROS levels by the mitoSOX staining of WT and Trx2ADKO (KO) differentiated adipocytes at day 4 in the presence or absence of mito-TEMPO (n = 3). (F) Quantification of mitochondrial ROS levels of WT and KO differentiated adipocytes at different time points (n = 3). AFU, arbitrary fluorescence unit. (G) ATP content of mitochondria from WT and KO adipocytes during differentiation (n = 6). (H and I) Confocal fluorescence images showing mitochondrial dynamics stained with TOMM20 antibody (H) and quantified mitochondrial density via fluorescence intensity (I; six images/mouse, n = 3 mice/group). (J) Western blot analysis of mitochondrial fusion mediators MFN1 and OPA1, fusion mediators Drp1 and Fis1 from WT and KO adipocytes at different differentiation time points. Protein levels were quantified and presented as fold changes by taking WT as 1.0 (n = 3). (K) Trx2 deletion in adipocytes decreased mitochondrial membrane potential. Mitochondrial membrane potential (ΔΨm) was assessed with the JC-1 probe by confocal microscopy at day 4 (left panel) and quantified by a red to green fluorescence intensities ratio (right panel). Scale bars, 20 µm. Data are representative of three experiments in 10 randomly selected fields from each group (n = 3). Ctrl, control. (L) The oxygen consumption rate (OCR) of WT and KO differentiated adipocytes measured by Seahorse at day 4 (n = 3). Quantitative data are presented as mean ± SEM. ns, not significant; *, P < 0.05; **, P < 0.01; ***, P < 0.001 versus the corresponding value for control. Significance was analyzed by two-tailed Student’s t test. Scale bars, 20 µm (C, E, H, and K). FCCP, carbonyl cyanide-4-(trifluoromethoxy)phenylhydrazone.

