Figure S5.
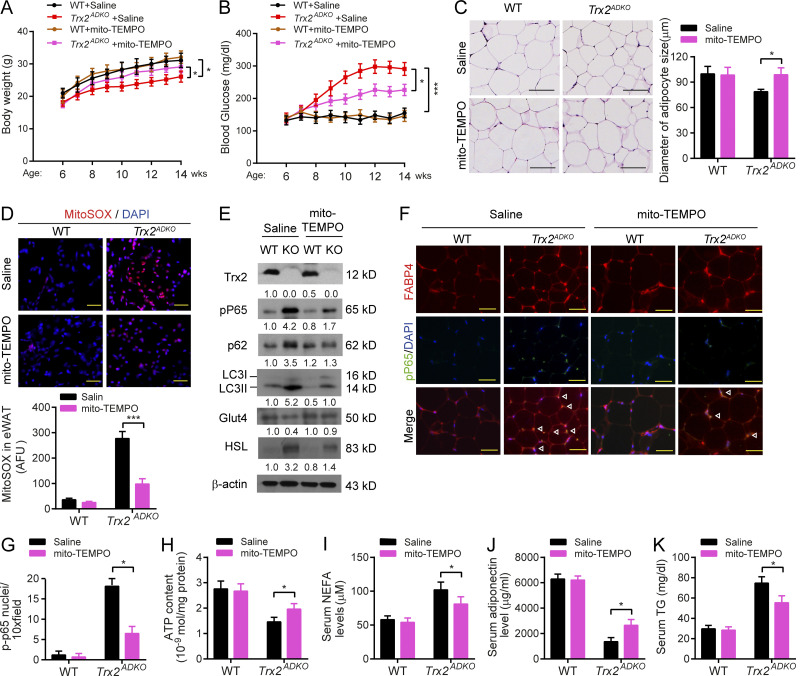
Mitochondria-specific antioxidant mito-TEMPO ameliorates adipocyte dysfunction and T2DM in Trx2ADKO mice. WT and Trx2ADKO mice at age of 6 wk received injections of mito-TEMPO (0.7 mg/kg/d, i.p. every other day) or vehicle (saline) for 8 wk. Body weight and blood glucose levels were measured at various ages and mouse tissues were harvested at week 14 for analyses. (A and B) Body weight (A) and fasting blood glucose levels (B) of mice at the indicated ages (n = 8 per group). (C) Representative hematoxylin and eosin staining showing overall eWAT morphology and adipocyte size in eWAT (n = 3 per group). (D) ROS analysis was performed by immunofluorescence microscopy of mitoSOX-stained eWAT, and quantification of fluorescence intensity with and without mito-TEMPO treatment. AFU, arbitrary fluorescence unit (n = 3 per group). (E) Immunoblot analysis of eWAT tissues (n = 3 per group). Protein levels were quantified and presented as fold changes by taking WT as 1.0. n = 3 mice for each group. (F and G) Coimmunostaining of phospho-P65 (green) and FABP4 (red) in eWAT sections. Representative images are shown in F with quantifications in G. n = 3 per group. White arrowheads indicate phospho-P65 in the nucleus. (H) ATP content of mitochondria isolated from eWAT of mice (n = 6 per group). (I–K) Plasma levels of NEFA (I), adiponectin (J), and TG (K; n = 8 per group). *, P < 0.05; ***, P < 0.001 (one-way ANOVA followed by Tukey’s post hoc test). Scale bars, 20 µm (C), 100 µm (D), and 50 µm (F).

