Figure 2.

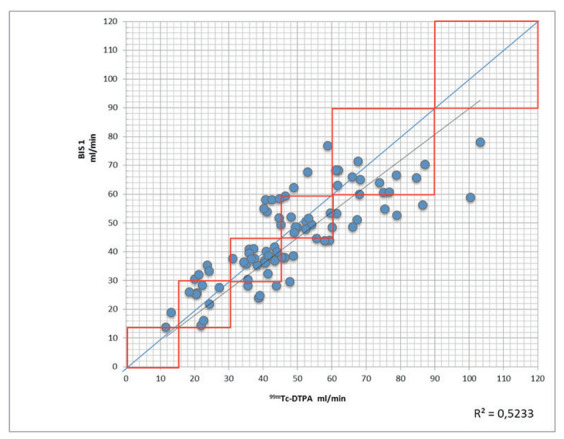
99mTc-DTPA vs. BIS1. The rectangles represent the clinical levels of GFR (see text). 99mTc-DTPA, 99mTc-diethylene triamine pentaacetic acid.

99mTc-DTPA vs. BIS1. The rectangles represent the clinical levels of GFR (see text). 99mTc-DTPA, 99mTc-diethylene triamine pentaacetic acid.