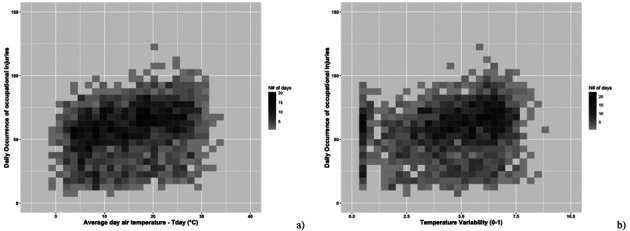
Figure 1.

Density plot for total occupational injuries vs. correspondent average day air temperature (Tday; a)), and temperature variability for the current and preceding day (TV0-1 = SD (Tmin day0, Tmax day0, Tmin day1, Tmax day1); b). A significant correlation was found for both models (i.e. Pearson’s r = 0.263, p < 0.001 for Tday vs. daily occupational injuries, and Pearson’s r = 0.221, p < 0.001 for TV0-1 vs. daily occupational injuries)
