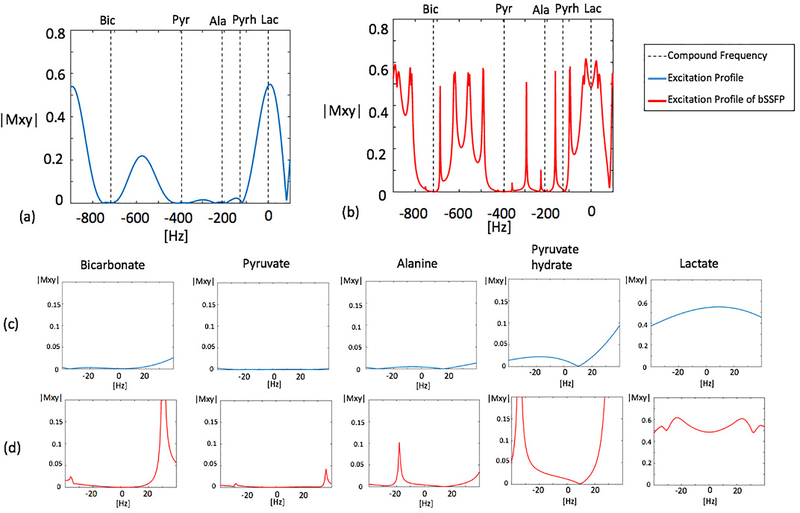
Figure 2:
Simulated excitation profiles of the excitation pulse alone (blue) and its averaged transverse magnetization over 64 pulses of a bSSFP acquisition (red). An overall view of the profile is shown in graph (a) and graph (b). Zoomed views (±40Hz) of excitation profiles around each metabolite are shown in graph (c) and graph (d). The excitation pulse has a 40Hz passband on lactate (0Hz), a 40Hz stopband of 5% maximum ripple on pyruvate hydrate (−128Hz) and 40Hz stopbands of 0.5% maximum ripples on bicarbonate (−717Hz), pyruvate (−395Hz) and alanine (−210Hz). Simulation parameters for bSSFP acquisitions include: number of RF pulses = 64, TR = 15.3ms, T1 = 30s, T2 = 1s, 6 non-linear ramp preparation pulses, flip angle = 60°

