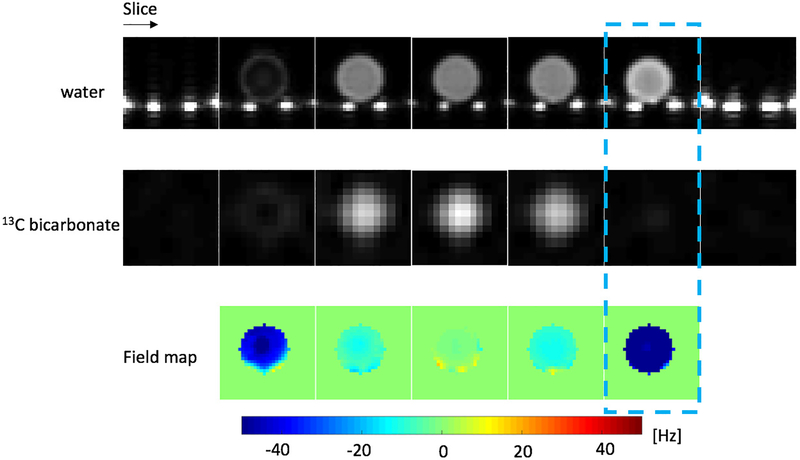
Figure 3:
Validation of the MS-3DSSFP sequence on a [13C]bicarbonate syringe phantom (T1 ∼= 26s, T2 ∼= 1.5s) with a rat birdcage coil. 13C images were acquired at 8 × 8 × 20mm and reconstructed at 4 × 4 × 20mm. Bright spots at the bottom of proton images are the water pad in the coil. B0 maps are shown at 13C frequency. The dash-line-boxed slice shows a bright proton image but a dark 13C image, consistent with the large B0 variation (−50Hz) at that slice.

