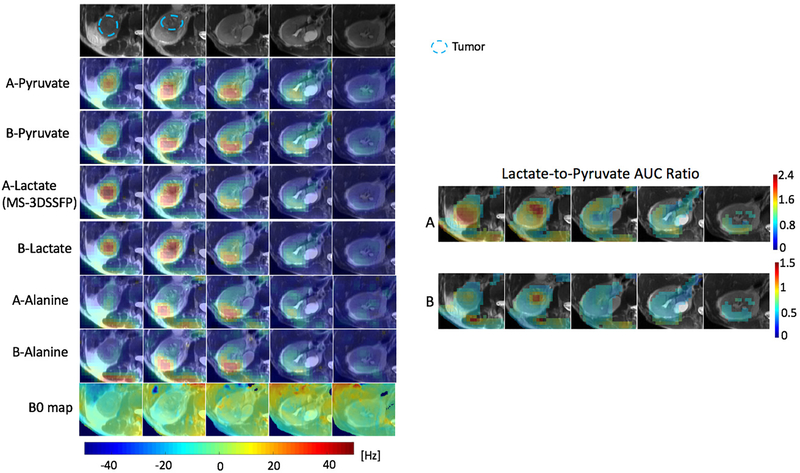
Figure 6:
Comparison of the MS-3DSSFP sequence with a multi-slice 2D MS-GRE sequence in the kidneys of a patient with a renal tumor with hyperpolarized [1-13C]pyruvate injections using experiment A (pyruvate and alanine: MS-GRE; lactate: MS-3DSSFP) and experiment B (pyruvate, lactate and alanine: MS-GRE). Experiment parameters are described in Table 1. AUC images of each metabolite, and lactate-to-pyruvate AUC ratio images and B0 maps are shown. B0 and AUC ratio maps are thresholded the same way as described in Figure 4. B0 maps colorbar is displayed at the bottom.

