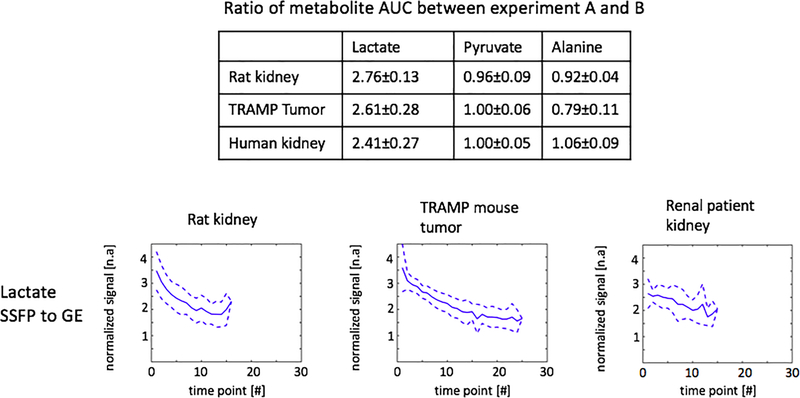
Figure 8:
Metabolites AUC ratios and lactate ratios of dynamic curves between experiment A (pyruvate and alanine: MS-GRE; lactate: MS-3DSSFP) and experiment B (pyruvate, lactate and alanine: MS-GRE) at each time point. Experiment parameters are described in Table 1. Data of rat kidneys, TRAMP tumors and human kidneys were included in the summary with a criterion of SNR greater than 3. The averaged lactate ratios are shown by the solid lines and ±1 standard deviations are shown by the dashed lines.

