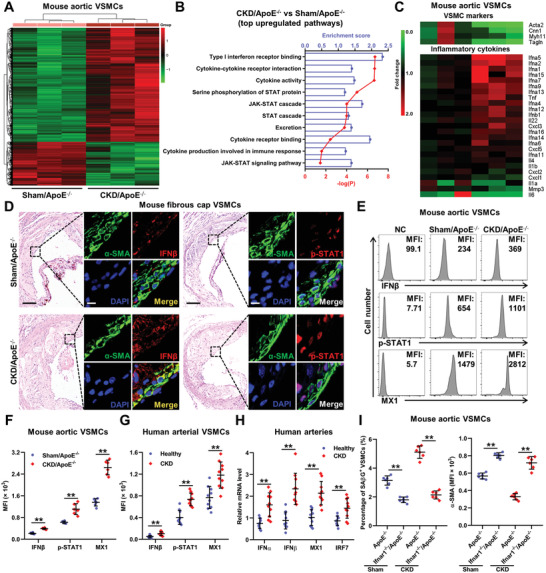
Figure 3.

IFN‐I response promotes VSMC premature senescence and phenotypic switching in CKD/ApoE−/− mice. A) The heat maps show genes that differently expressed in aortic VSMCs of Sham/ApoE−/− and CKD/ApoE−/− mice. B) KEGG and GO enrichment analysis of top upregulated pathways in aortic VSMCs of CKD/ApoE−/− mice. C) The heat maps show the relative expression levels of VSMC markers and inflammation cytokines based on the integrated microarray analysis of aortic VSMCs of Sham/ApoE−/− and CKD/ApoE−/− mice. D) Representative images of HE, IFNβ and p‐STAT1 staining in fibrous cap VSMCs of Sham/ApoE−/− and CKD/ApoE−/− mice. Scale bar (HE), 100 µm. Scale bar (IF), 10 µm. E) Representative FC analysis of IFNβ, p‐STAT1, and MX1 expressions in aortic VSMCs of Sham/ApoE−/− and CKD/ApoE−/− mice. F) The MFIs of IFNβ, p‐STAT1, and MX1 in aortic VSMCs of Sham/ApoE−/− and CKD/ApoE−/− mice (n = 6). G) The MFIs of IFNβ, p‐STAT1, and MX1 in arterial VSMCs of healthy people and CKD patients (n = 10). H) Relative mRNA expression levels of IFNα, IFNβ, IRF7, and MX1 in arteries from healthy people and CKD patients (n = 10). I) The percentage of SAβG+ VSMCs and the MFI of α‐SMA in VSMCs of Sham/ApoE−/−, Sham/Ifnar1−/−/ApoE−/−, CKD/ApoE−/−, and CKD/Ifnar1−/−/ApoE−/− mice (n = 6). Data represent mean ± SD. **p < 0.01, two‐tailed Student's t‐test was applied to (F–H); one‐way ANOVA was applied to (I).
