Figure 1.

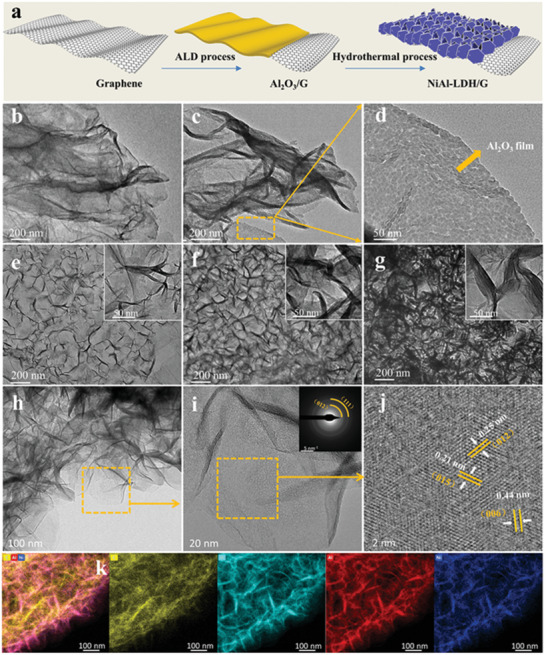
a) Schematic illustration of the preparation process of NiAl‐LDH/G. TEM images of b) graphene, c,d) Al2O3/G, e) 50 NiAl‐LDH/G, f) 100 NiAl‐LDH/G, and g) 150 NiAl‐LDH/G, respectively. h,i) TEM and j) HRTEM images of NiAl‐LDH nanoflakes in the 100 NiAl‐LDH/G sample. k) Elemental maps of C, O, Al, and Ni in the 100 NiAl‐LDH/G sample.
