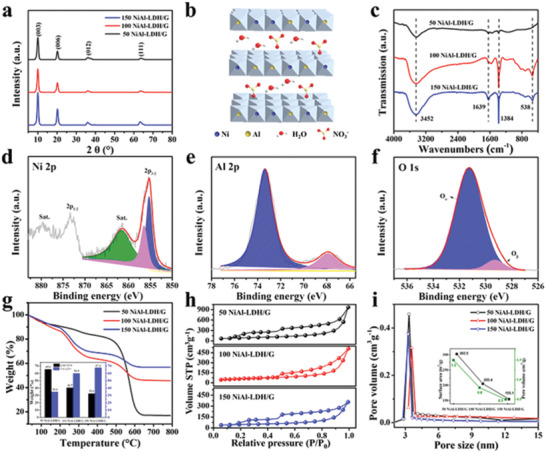
Figure 2.

a) XRD patterns of NiAl‐LDH/G samples. b) Crystal structure of NiAl‐LDH‐NO3 −. c) FTIR analysis of NiAl‐LDH/G samples. High‐resolution XPS profiles of d) Ni 2p, e) Al 2p, and f) O1s for the 100 NiAl‐LDH/G sample. g) TG curves in the range of 30–800 °C under air and the weight ratio between NiAl‐LDH and graphene in the NiAl‐LDH/G samples. h) BET surface area and i) pore size distribution of NiAl‐LDH/G samples.
