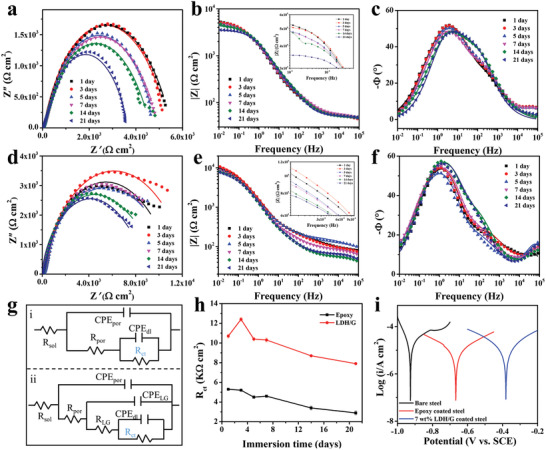
Figure 7.

a) Nyquist plots, b) impedance–frequency Bode plots, and c) phase–frequency Bode plots of pure epoxy‐coated steel. d) Nyquist plots, e) impedance–frequency Bode plots, and f) phase–frequency Bode plots of 7 wt% NiAl‐LDH/G/epoxy‐coated steel. g‐i,ii) Equivalent circuit used to simulate the EIS data of coated steel. h) Tafel plots recorded in a 3.5 wt% NaCl solution for bare steel, pure epoxy‐coated steel, and 7 wt% NiAl‐LDH/G/epoxy‐coated steel. i) XRD patterns of bare steel, pure epoxy‐coated steel, and 7 wt% NiAl‐LDH/G/epoxy‐coated steel immersed in a 3.5 wt% NaCl solution for 21 days.
