Figure 4.

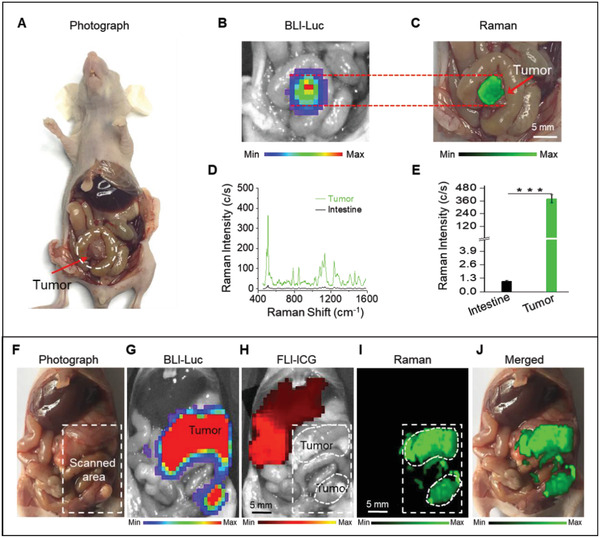
A–G) Raman imaging of orthotopic CT26 colon and F–J) SKOV3 ovarian tumors. A,B) Photograph and in situ BLI of a mouse with orthotopic CT26 colon tumor and C) Raman image of the tumor. D) Raman spectra and E) Raman signals of the tumor and surrounding intestine tissues, showing significant accumulation of the nanoparticles within the tumor, without any detectable uptake in the normal intestine tissues. F) Photograph of the exposed abdomen shows multiple SKOV3 tumors, which were confirmed by in situ BLI of the tumor shown in (G). Raman images in (I) match well with the tumor BLI signal (G), showing retention of the nanoparticles within the tumors and helped delineation of the tumor margins. However, H) the ICG fluorescent signals were only observed at liver, indicating that all ICG were cleared from the body and accumulated in liver. Fluorescence image in (H) was captured 24 h after intravenous injection of ICG. J) The overlaid version of the Raman image on its counterpart abdominal photograph. The selected region for Raman imaging is shown with a white‐color dashed rectangle. Raman images were captured under 785 nm laser (150 mW, 5× objective, 0.2 s integration time, and the total time is ≈10 min for (C) and ≈32 min for (I), respectively). Data are presented as the mean ± SD, p values were calculated by Student's t‐test, (n = 5, ***p < 0.001, relative to the control group).
