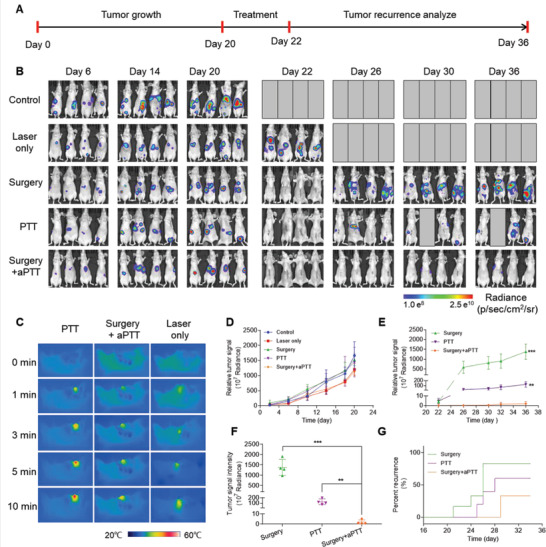
Figure 8.

Raman image‐guided resection and adjuvant photothermal therapy (aPTT) of the orthotopic SKOV3 ovarian tumors. A) Timeline of the procedures, including image‐guided surgery in combination with photothermal therapy of the orthotopic SKOV3 ovarian tumor‐bearing mice. B) Bioluminescent images of the mice showing the variation of tumor signals at different treatment stages in all five groups. C) Thermal images of the tumor or tumor bed during PTT, aPTT, and Laser only treatments, representing the thermal response of the nanoparticles or tumor tissue to laser (808 nm, 1.5 W cm−2, 10 min). D) Diagram showing variation of the tumor BLI signals in all 5 groups before starting the treatments. E) Variation of the tumor BLI signals during different treatments, started at day 22 and terminated at day 36 (see the timeline in (A) for details). F) Relative tumor signals measured in different groups after 36 days. G) Kaplan–Meier plot showing the rate of tumor recurrences in five different treatment groups. In vivo bioluminescence images were used to track tumor recurrence in different groups of mice. Data are presented as the mean ± SD, p values were calculated by Student's t‐test, (n = 4, **p <0.01, ***p <0.001, relative to the control mice).
