Figure 4.

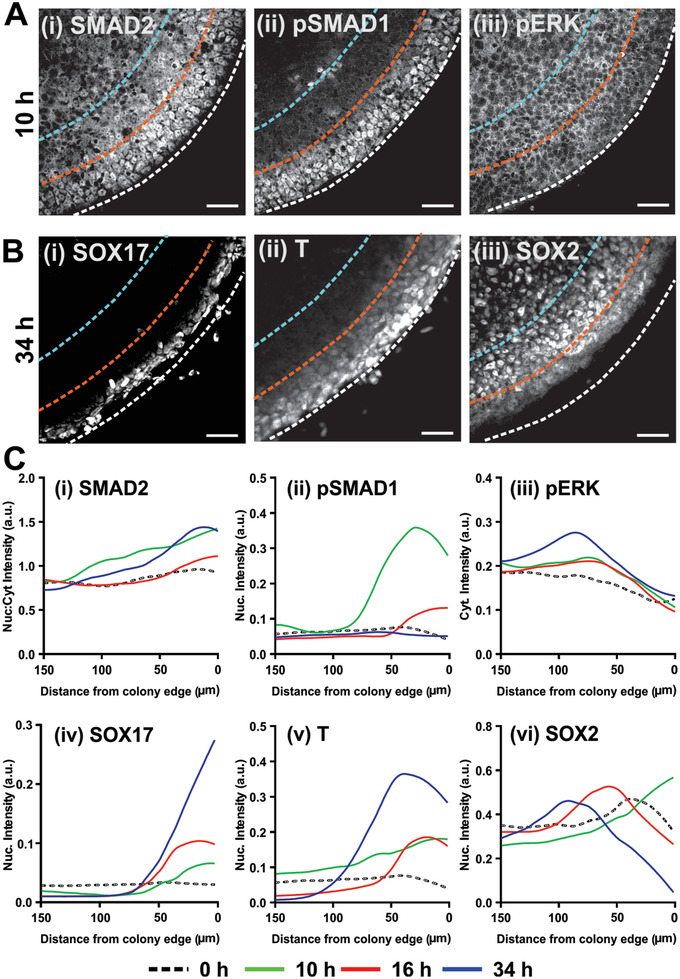
Spatio‐temporal patterning of intracellular signaling and cell lineages preceded 3D tissue morphogenesis in ME‐primed μNET. A,B) Immunofluorescence images showing localization patterns of Smad1, Smad2, and ERK signaling and lineage markers in H9 derived μP‐hPSC colony periphery. A) μP‐hPSC colonies after 10 h of ME induction exhibited (i) nuclear localization of SMAD2 near the colony periphery and cytoplasmic localization toward the colony interior, (ii) a strong band of nuclear pSMAD1 at the colony periphery, and (iii) relatively homogeneous expression of pERK along the edge and interior of the colony. B) μP‐hPSC colonies at 34 h after differentiation exhibited spatial patterning of germ lineage markers (i) SOX17, (ii) T, (iii) SOX2. Dotted lines in (A) and (B) denote 50 µm (orange) and 100 µm (blue) radial distance from colony edges (white). C) Averaged spatio‐temporal profiles of (i) SMAD2 nuclear:cytoplasmic (Nuc:cyt) intensity ratio, (ii) nuclear pSMAD intensity, (iii) cytoplasmic pERK intensity, (iv) nuclear SOX17 intensity, (v) nuclear T intensity, and (vi) nuclear SOX2 intensity as a function of time after induction of μP‐hPSCs colonies. Data are average ± s.e.m of three colonies from two independent experiments. Scale bars in (A) and (B) = 50 µm.
