Figure 6.

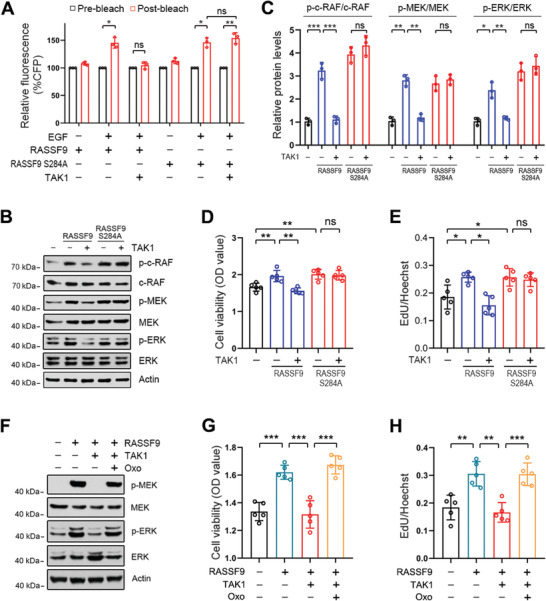
TAK1 inhibits RASSF9‐induced signal transduction through the RAS/RAF/MEK/ERK axis. A) TAK1 inhibits RASSF9‐mediated RAS dimerization. ECA‐109 cells were co‐transfected with plasmids expressing CFP‐KRAS, YFP‐KRAS, RASSF9, RASSF9S284A, and TAK1 as indicated. CFP emission was assayed by FRET (n = 3 biologically independent replicates per group). B) TAK1 blocks signal transduction through the RAF/MEK/ERK axis induced by RASSF9. ECA‐109 cells were co‐transfected with plasmids containing RASSF9, RASSF9S284A, or TAK1. Signal transduction through the RAF/MEK/ERK axis was analyzed by western blotting using antibodies as indicated. Representative blots were shown (n = 3 biologically independent replicates per group). C) Quantitative analysis of the western blot data shown in (B). D) TAK1 has no effects on cell viability induced by RASSF9S284A. ECA‐109 cells were co‐transfected with plasmids expressing TAK1, RASSF9, or RASSF9S284A. 36 h post‐transfection, cell viability was analyzed by CCK8 (n = 5 biologically independent replicates per group). E) TAK1 fails to inhibit cell proliferation induced by RASSF9S284A. Cell treatments were described in (D). 36 h post‐transfection, cell proliferation was evaluated by EdU incorporation assay (n = 5 biologically independent replicates per group). F) Inhibition of TAK1 ameliorates RASSF9 downstream signal transduction. ECA‐109 cells were transfected with plasmids expressing RASSF9 or TAK1 as indicated. 12 h post‐transfection, the cells were treated with 10 µm Oxo for additional 24 h. Representative blots were shown (n = 3 biologically independent replicates per group). G) TAK1 inhibition recues decreased cell viability induced by TAK1. Cell treatments were described in (F). Cell viability was assayed by CCK8 (n = 5 biologically independent replicates per group). H) TAK1 inhibition recues decreased cell proliferation induced by TAK1. Cell treatments were described in (F). Cell proliferation was analyzed by EdU incorporation assay (n = 5 biologically independent replicates per group). Protein levels were measured by western blot analysis. Actin was used as a loading control. Data are presented as mean ± SD (error bars). Statistical significance was tested by two‐tailed one‐way ANOVA test. *p < 0.05, **p < 0.01, and ***p < 0.001. ns means no significance.
