Fig. 2.
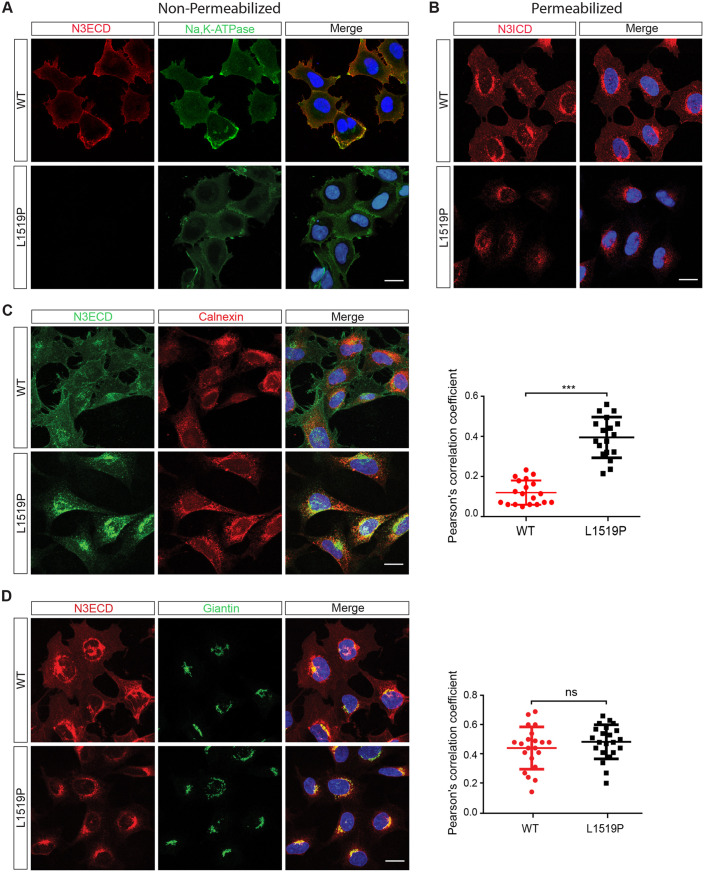
Lack of cell surface expression and increased retention of NOTCH3L1519P in the endoplasmic reticulum (ER). (A,B) Confocal images of wild-type and NOTCH L1519P-expressing cells without (A) and with (B) permeabilization. Na,K-ATPase was used as a membrane marker. (C) Immunocytochemistry for NOTCH3 ECD (green) and the ER marker calnexin (red) from permeabilized cells; the plot shows the Pearson's correlation coefficients for the colocalization analysis. (D) Immunocytochemistry for NOTCH3 ECD (red) and the Golgi marker giantin (green); the graph shows the Pearson's correlation coefficient analysis (n=3). Significance was calculated using unpaired Student's t-test, ***P<0.001; ns, not significant. Scale bars: 20 µm.

