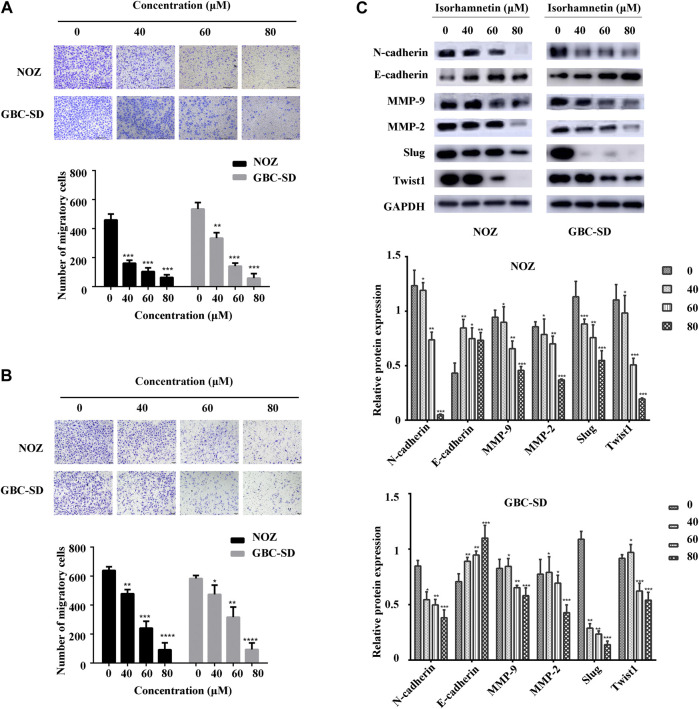
FIGURE 2.
Isorhamnetin repressed GBC cell migration and invasion. (A,B) Cell migration and invasion of NOZ and GBC-SD detected after isorhamnetin treatment (0, 40, 60, 80 μM) for 18 h. The migrated cell numbers were computed in five random fields in each group. (C) The expression levels and statistic results of MMP-2, Slug, MMP-9, E-cadherin, N-cadherin, and TWIST1 in NOZ and GBC-SD after isorhamnetin treatment. GAPDH was used as the loading control. *p < 0.05, **p < 0.01, ***p < 0.001, relative to the control group.

