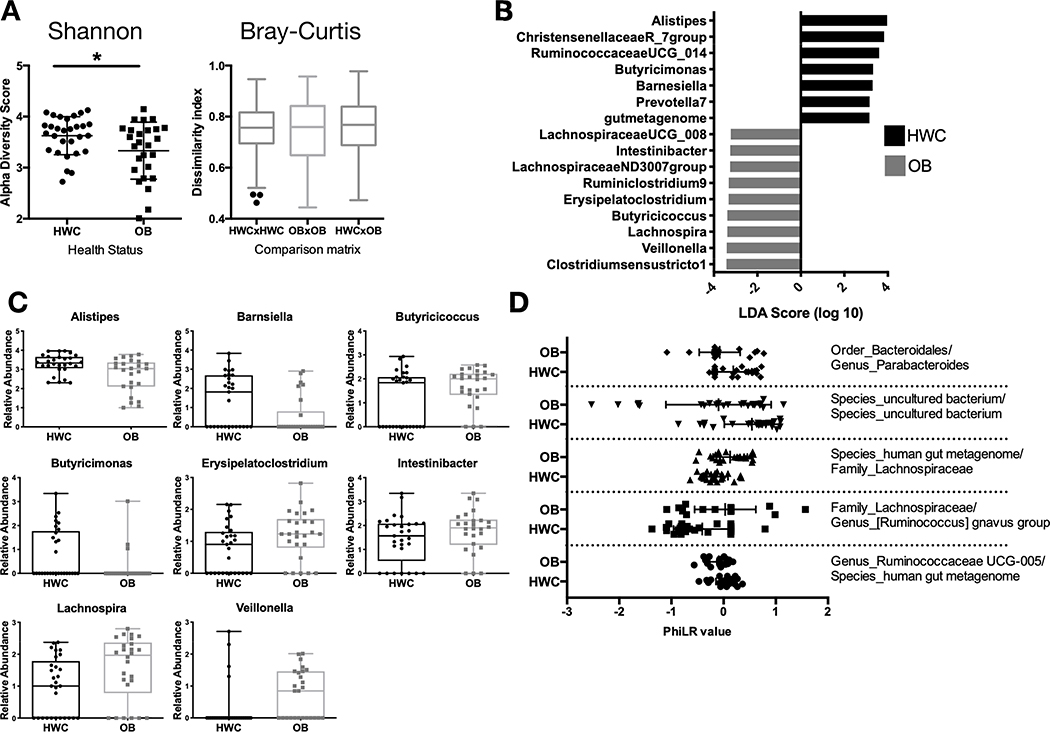
Figure 3. A subset of adolescents with obesity have reduced gut microbial diversity and differences in abundance of specific microbial taxa when compared to their healthy weight counterparts.
(A) Shannon α-diversity and Bray Curtis β-diversity metrics between HWC and OB stool 16S rRNA gene sequences based on identified amplicon sequence variants. (B-C) The Linear discriminant analysis (LDA) effect size tool (LEfSe) was applied to taxonomic data resulting from 16S rRNA gene amplicon sequencing. (B) Relative abundance of taxa with that vary significantly by cohort are displayed. (C) Count data of each taxon with a significantly different abundance between HWC and OB cohorts in the LDA analysis. Each symbol represents abundance in an individual sample. (D) PhiLR Taxa identified by 16S rRNA gene sequencing that were present at a read count of > 3 across at least 10% of patient samples were retained for analysis. PhiLR results are displayed as log relative abundances of opposing clades in a phylogenetic tree and significant balances were chosen on the basis of a simple predictive model. A PhILR value greater than zero indicates greater abundance of the numerator component relative to the denominator component and a negative value indicates the reverse. These balances were most effective at predicting patient membership in either the HWC or OB cohort. See Methods section for details on statistical analyses and access to relevant R code.

