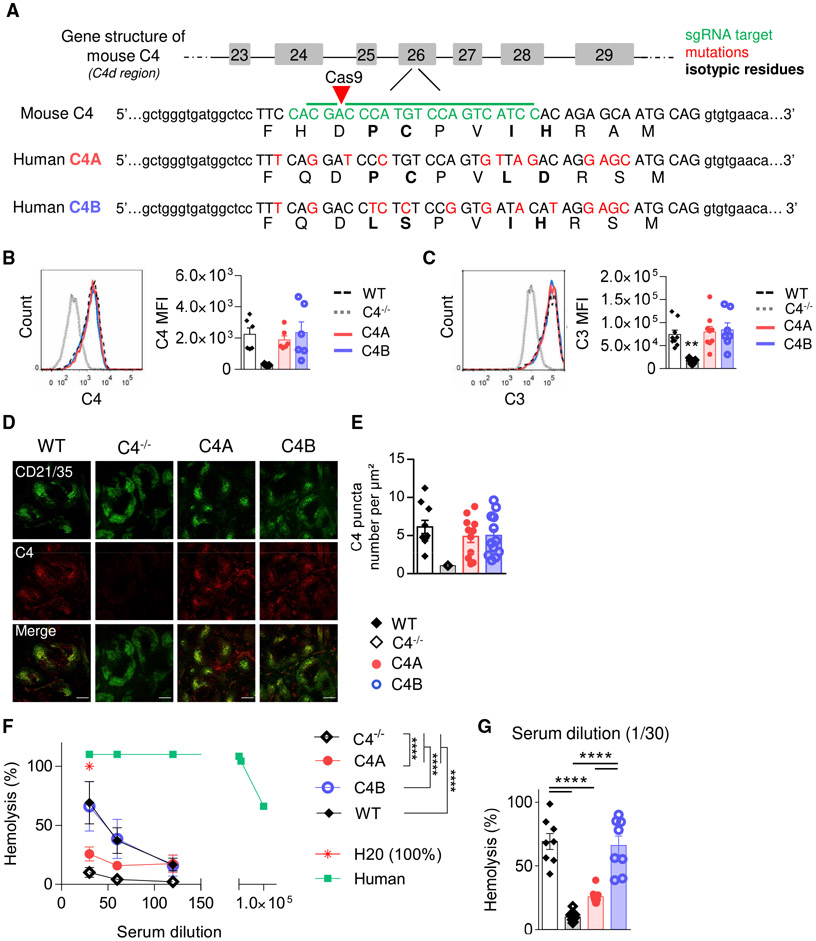
Figure 1. Generation of C4A and C4B Gene-Edited Mouse Strains.
(A) Simplified representation of C4A and C4B mouse generation using Crispr-Cas9 technology. sgRNA target in green, mutations in red, isotypic residues modulating covalent binding affinities of C4 in bold, and isotypic region in capital letters.
(B and C) Assessment of C4- and C3-coated immune complexes (ICs) in vitro. WT, C4A, C4B, or C4−/− mouse serum was incubated with an artificial IC. Left panels, representative dot plot; right panels, C3 and C4 mean fluorescence intensity (MFI) on ICs evaluated by flow cytometry. Means ± SEMs. One dot represents 1 mouse. n > 6 for each strain; 1-way ANOVA with Tukey’s test.
(D and E) C4 puncta quantification on FDC networks in spleen.
(D) Representative image of spleen immunostained for FDCs (anti-CD21 Ab, 7E9 clone, blue) and mouse C4 (16D2 clone, red). Scale bar represents 200 μm.
(E) The number of C4 puncta per μm2 of FDC network was quantified using Cell Profiler software. Means ± SEMs. One dot represents 1 field of view; n > 9; 3 mice per group.
(F and G) Analysis of hemolytic activity of C4−/−, WT, C4A, and C4B serum. Mean ± SEM (F); 1 dot represents the average value of 8 mice ± SD. H2O was considered 100% of lysis. Human serum was used as a positive control. Two-way ANOVA with Tukey’s test. (G) Results for 1/30 dilution; Means ± SEMs; 1 dot represents 1 mouse; 1-way ANOVA with Tukey’s test.
****p < 0.0001. See also Figure S1.

