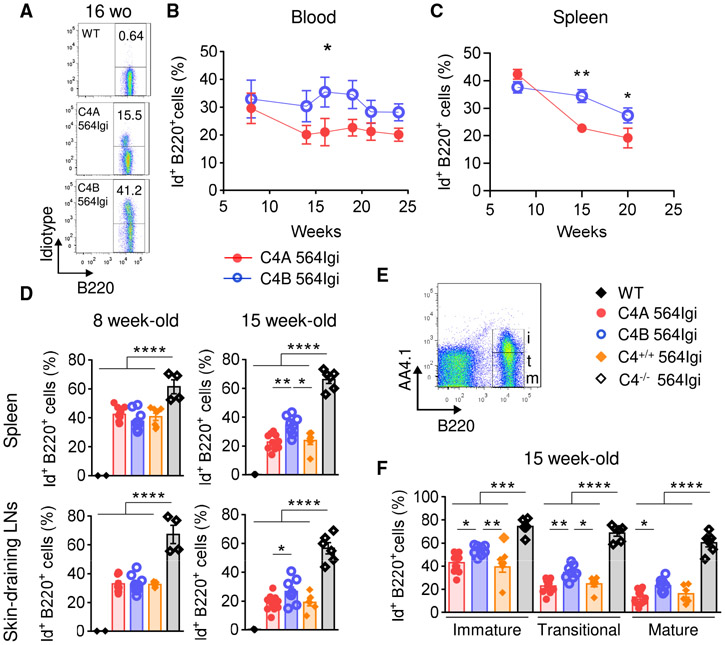
Figure 2. Absence of C4A Leads to Impaired Regulation of Autoreactive B Cells in Periphery.
(A and B) Analysis of autoreactive B cell population (B220+ Id+) in peripheral blood of C4A 564Igi (n = 5) and C4B 564Igi (n = 8) by flow cytometry. (A) Representative dot plots. (B) Percentage of Id+ B cells within the total B220+ B cell population. Means ± SEMs; Mann-Whitney test; 1 dot represents the average percentage for 1 strain.
(C–E) Analysis of autoreactive Id+ B cells within the total B220+ B cell population in secondary lymphoid organs by flow cytometry.
(C) Proportion of splenic Id+ B cells within the total B220+ B cell population from 8, 15, and 20 wo C4A and C4B 564Igi mice. Means ± SEMs; Mann-Whitney test; each dot represents the average of n > 8 mice.
(D) Proportion of Id+ B cells within the total B220+ B cell population in spleen (top panel) and skin-draining LNs (bottom panel) from 8 and 15 wo C4A, C4B, C4+/+, and C4−/− 564Igi. Means ± SEMs; 1-way ANOVA with Tukey’s test; each dot represents 1 mouse; n > 4 for each strain.
(E) Gating strategy to discern immature (i, B220+ AA4.1+), transitional (t, B220+ AA4.1int), and mature (m, B220+ AA4.1−) splenic B cell subpopulations.
(F) Proportions of Id+ B cells within immature, transitional, and mature splenic B cell subpopulations of 15 wo C4A, C4B, C4+/+, and C4−/− 564Igi. Means ± SEMs; 1-way ANOVA with Tukey’s test; each dot represents 1 mouse; n > 6.
*p < 0.05, **p < 0.01, ***p < 0.001, ****p < 0.0001. See also Figure S2.

