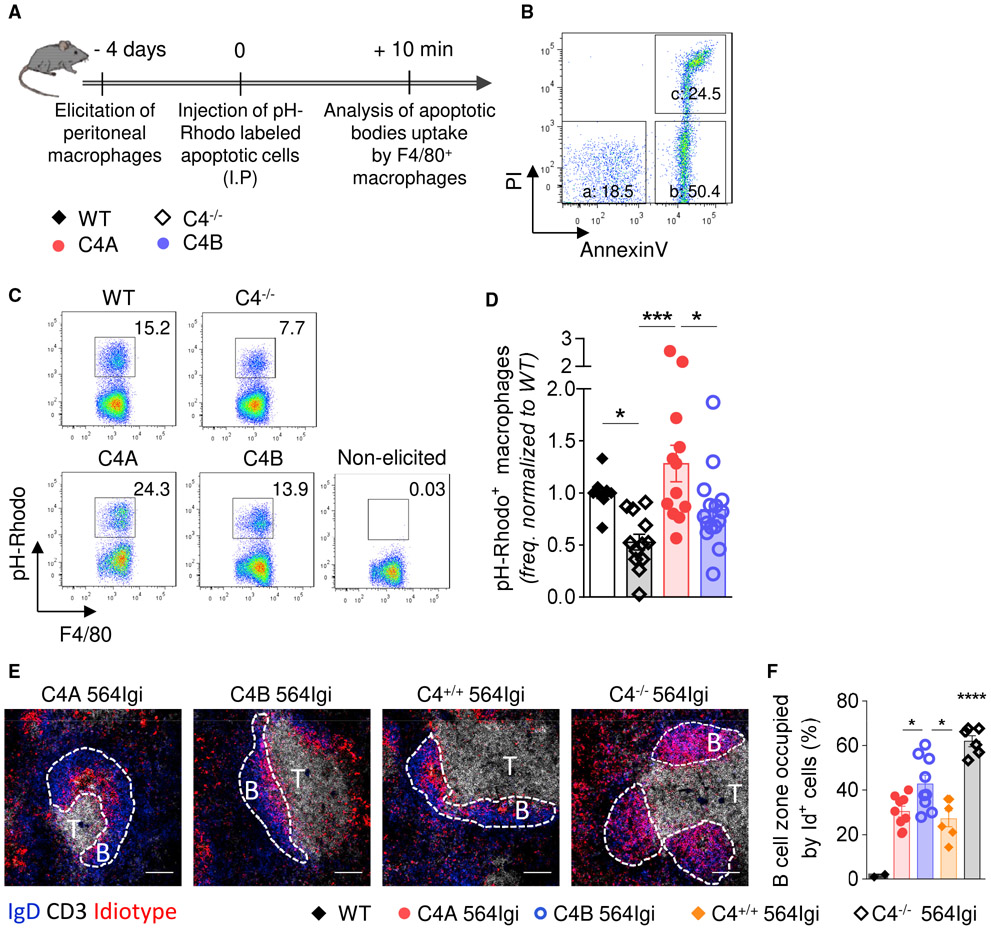
Figure 5. C4A Is More Efficient Than C4B in Inducing Clearance of Apoptotic Cells In Vivo and Driving Effective Follicular Exclusion of Id+ B Cells.
(A) Experiment timeline.
(B) Representative dot plot of apoptotic stages analyzed by flow cytometry using propidium iodide (PI) and annexinV (AnnV) staining (a [live cells]: AnnV− PI−; b [early apoptosis]: AnnV+ PI−; c [late apoptosis]: AnnV+ PI+).
(C and D) Analysis of apoptotic cell uptake by F4/80+ macrophages. (C) Representative dot plots of apoptotic cell uptake by macrophages (pH-Rhodo+) for all of the strains. (D) Frequency of macrophages ingesting apoptotic bodies, analyzed by flow cytometry and relative to WT mice. Means ± SEMs; each dot represents 1 mouse; n > 10 over 6 independent experiments; 1-way ANOVA with Tukey’s test; *p < 0.05; ***p < 0.005.
(E and F) Analysis of Id+ B cell follicular exclusion at 20 wo. (E) Representative image of splenic follicles. Follicular B cells: IgD (blue), T cell zone: CD3 (white), Id+ B cells: anti-idiotype (9D11 clone) (red). The scale bar represents 100 μm. The dashed lines determine B cell follicles. (F) Follicular exclusion, expressed as percentage of follicular B cell zone occupied by Id+ B cells, was quantified using Cell Profiler software. Means ± SEMs; each dot represents 1 mouse; n > 5; 1-way ANOVA with Tukey’s test; *p < 0.05; ****p < 0.001.
See also Figure S5.

