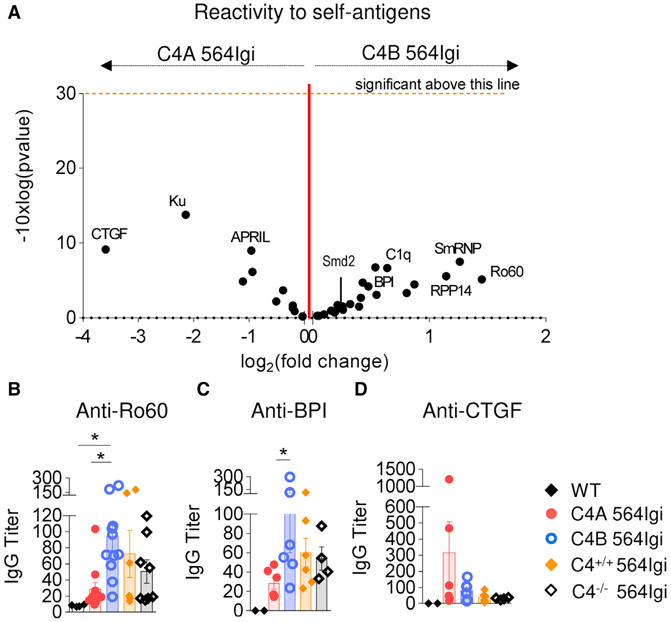
Figure 6. C4A Lessens Autoantibody Production in the 564Igi Lupus Model.
(A) Volcano plot comparison of median IgG signal intensities in C4A 564Igi (n = 8) relative to C4B 564Igi (n = 10) mice. Log2(fold change) appears on the x axis. Significance (presented as −10 × log10[p value]) is on the y axis. The p value was obtained running multiple unpaired t tests corrected with the Holm-Sidak method. One dot represents 1 self-Ag.
(B–D) Dosage of anti-Ro60, -BPI, and -CTGF IgG titers in serum of 15–20 wo C4−/−, C4A, C4B, and C4+/+ 564Igi by ELISA. Means ± SEMs; 1 dot represents 1 mouse; n > 4; 1-way ANOVA with Tukey’s test; *p < 0.05.

