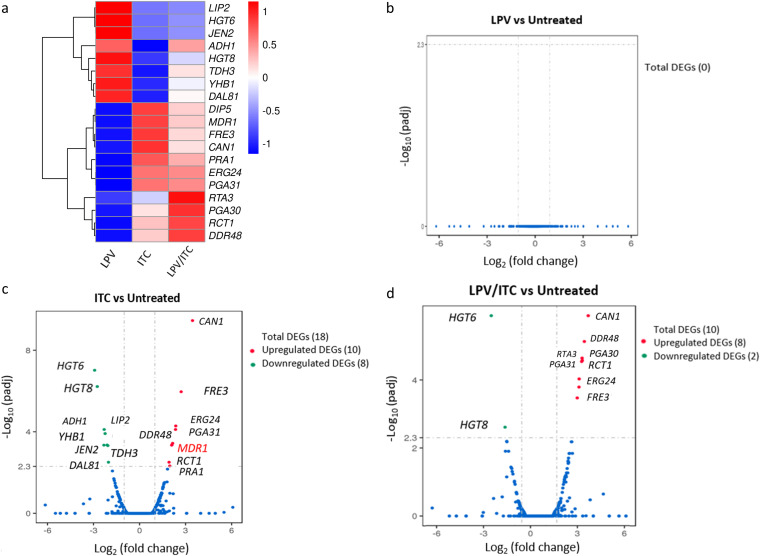
FIG 4.
Effects of lopinavir, itraconazole, and a combination of the two drugs on the C. auris transcriptome. Shown is a transcriptional comparison of C. auris AR0390 treated with LPV, ITC, or a combination of both drugs versus the untreated control. (a) Heat map of FPKM values of DEGs of each treatment versus the untreated control, scaled by row. Genes were clustered using hierarchical clustering based on Euclidean distance. (b) Volcano plot of DEGs from C. auris AR0390 treated with LPV at 10 μg/ml. (c) Volcano plot of DEGs from C. auris AR0390 treated with ITC at 1 μg/ml. (d) Volcano plot of DEGs from C. auris AR0390 treated with the lopinavir/itraconazole (LPV/ITC) combination.

