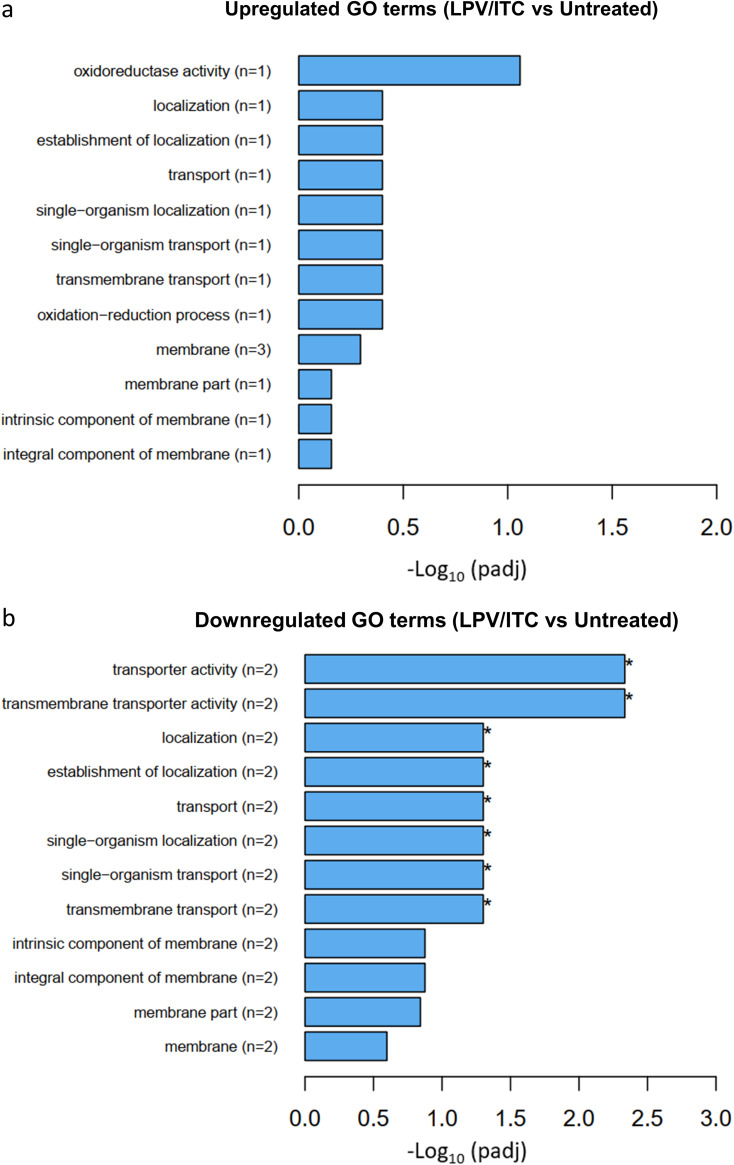
FIG 5.
Gene Ontology (GO) enrichment analysis of differentially expressed genes in the lopinavir/itraconazole-treated sample. GO analysis was implemented by the Cluster Profiler R package, and a P value of ≤0.05 was used as the cutoff parameter. Upregulated GO terms (a) and downregulated GO terms (b) are shown.

