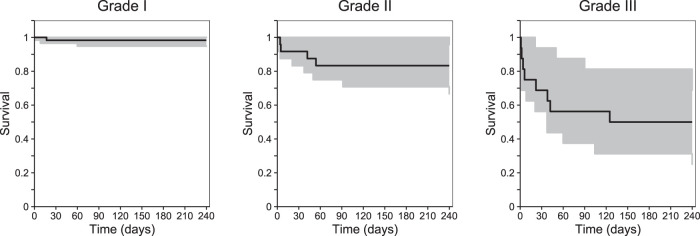
FIG 7.
Time-to-event survival analysis, stratified. Visual predictive plots represent the final pharmacodynamic model, stratified by TBM severity (grades I to III). The black lines represent the observed data. Shaded areas represent the 95% prediction intervals for the simulated data (n = 1,000). Data were subjected to right-censoring for patients lost to follow-up or at the end of the study (240 days).

