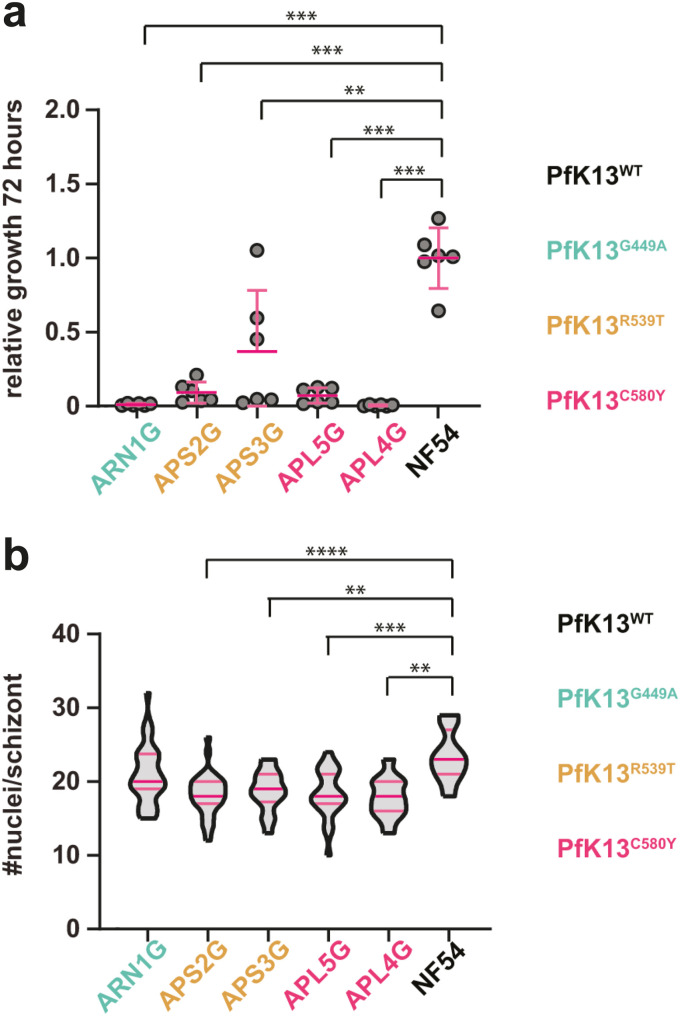
FIG 1.
Characterization of P. falciparum clinical isolates. (a) Relative cumulative growth of P. falciparum clinical isolates compared to NF54. Parasitemia was measured by flow cytometry every other day for eight consecutive days (four replication cycles). Six biological replicates from two parallel experiments are shown. Clinical isolates with K13var grow significantly slower than NF54 (K13WT, unpaired t test, **, P < 0.01; ***, P < 0.0001). Error bars denote standard deviation (SD). (b) K13var parasites have less nuclei per schizont than NF54 parasites with the exception of isolate ARN1G (unpaired t test, **, P < 0.01; ***, P < 0.0001). Dark pink bars indicate the median and light pink bars denote the interquartile range.

