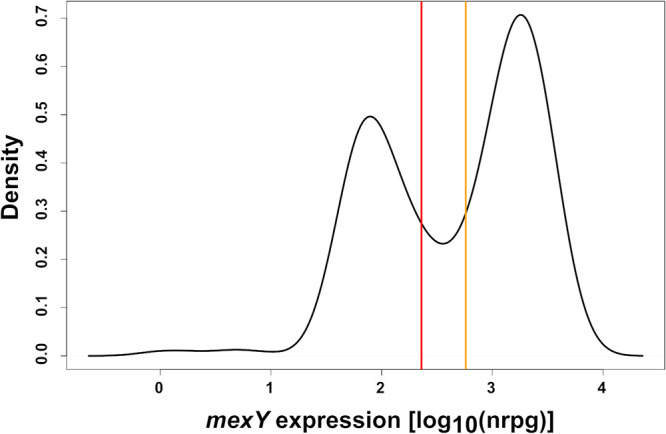
FIG 1.

Distribution of mexY expression values and cutoff values for high mexY expression across clinical P. aeruginosa isolates. The distribution of log10 expression values (NRPGs) of mexY over all analyzed clinical isolates (n = 412) (28) is depicted. Cutoff values for high (orange line) and low (red line) mexY expression were defined as the 30% distance from the lowest point between the two maxima of the distribution to the two maxima, respectively.
