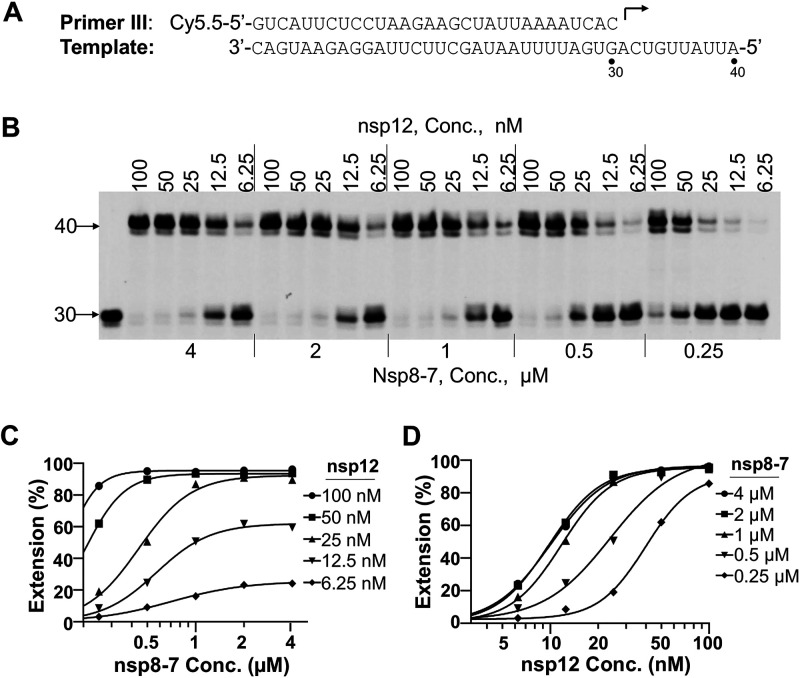
FIG 4.
nsp12 and nsp8-7 concentration optimization. (A) P/T complex used in this assay. (B) Analysis of the primer extension activity in the presence of different concentrations of nsp12 and nsp8-7. Serial dilutions of nsp12 (indicated above the gel), serial dilutions of nsp8-7 (indicated below the gel), and 5 nM P/T were used in this assay. Reactions were initiated by the addition of 100 μM rNTP, carried out at 37°C for 1 h, and then stopped by addition of stopping solution. The products were separated on denaturing PAGE gels. The first lane on the left represents the reaction without rNTP added, which serves as a negative control. The numbers on the left of the gels indicate the locations of the 30-mer primer and 40-mer full-length product. (C) The percentage of full-length products in panel B was plotted against the nsp8-7 concentrations. The results were fitted to sigmoidal dose-response curves using the GraphPad Prism program. (D) The percentage of full-length products in panel B was plotted against the nsp12 concentrations. The results were fitted to sigmoidal dose-response curves using the GraphPad Prism program.

