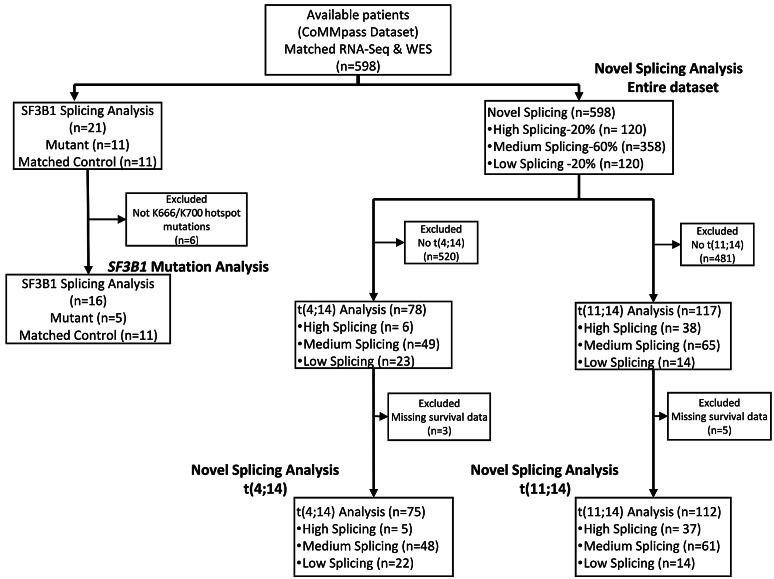
Figure 1.
CONSORT flow diagram of breakdown of sample subsets used for each analysis. Four subsets of the data were used, which included the SF3B1 mutation analysis, novel splicing in the entire dataset, as well as novel splicing in the multiple myeloma subgroups t(4;14) and t(11;14). Reasons for exclusion of samples for each analysis are provided. CoMMpass: Clinical Outcomes in Multiple Myeloma to Personal Assessment of Genetic Profile; n: number.

