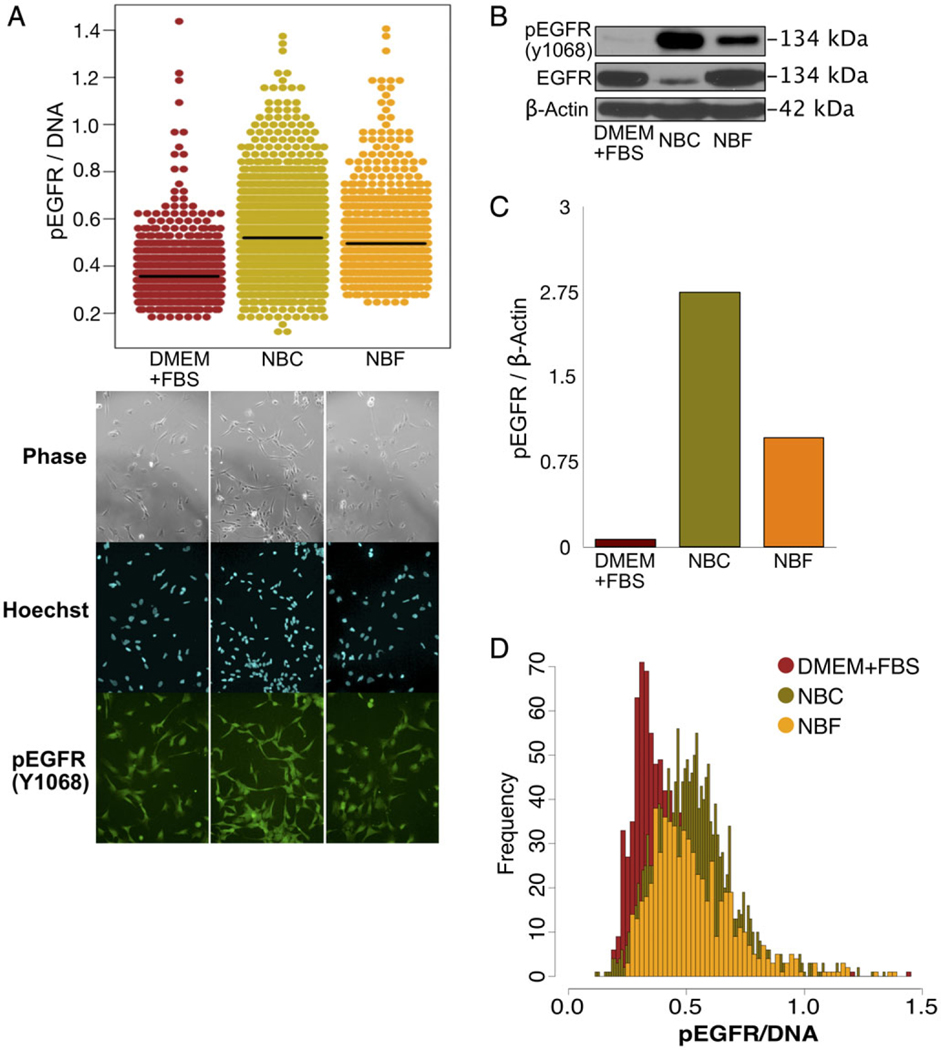
Figure 2.
HASCIA method validation and assessment of GSC population heterogeneity. (A) Immunofluorescence staining and quantification using HASCIA. Adherent CSC monolayer was treated for 3 days with DMEM + FBS, EGF-containing NBC or with NBF medium. The cells were then fixed and stained for phosphorylated Y1068 EGFR, and Hoechst was used to stain DNA as a nuclear standard. Quantification with HASCIA revealed significant differences in pEGFR expression between the three groups. (B) In parallel, after similar treatment an immunoblotting analysis was performed with whole cell lysates. (C) Densitometry analysis of the immunoblotting revealed similar trend of pEGFR changes with different media. (D) Histograms of expression distribution measured by HASCIA revealed differences in diversity and distribution shape in addition to changes in average pEGFR expression. [Color figure can be viewed at wileyonlinelibrary.com]

