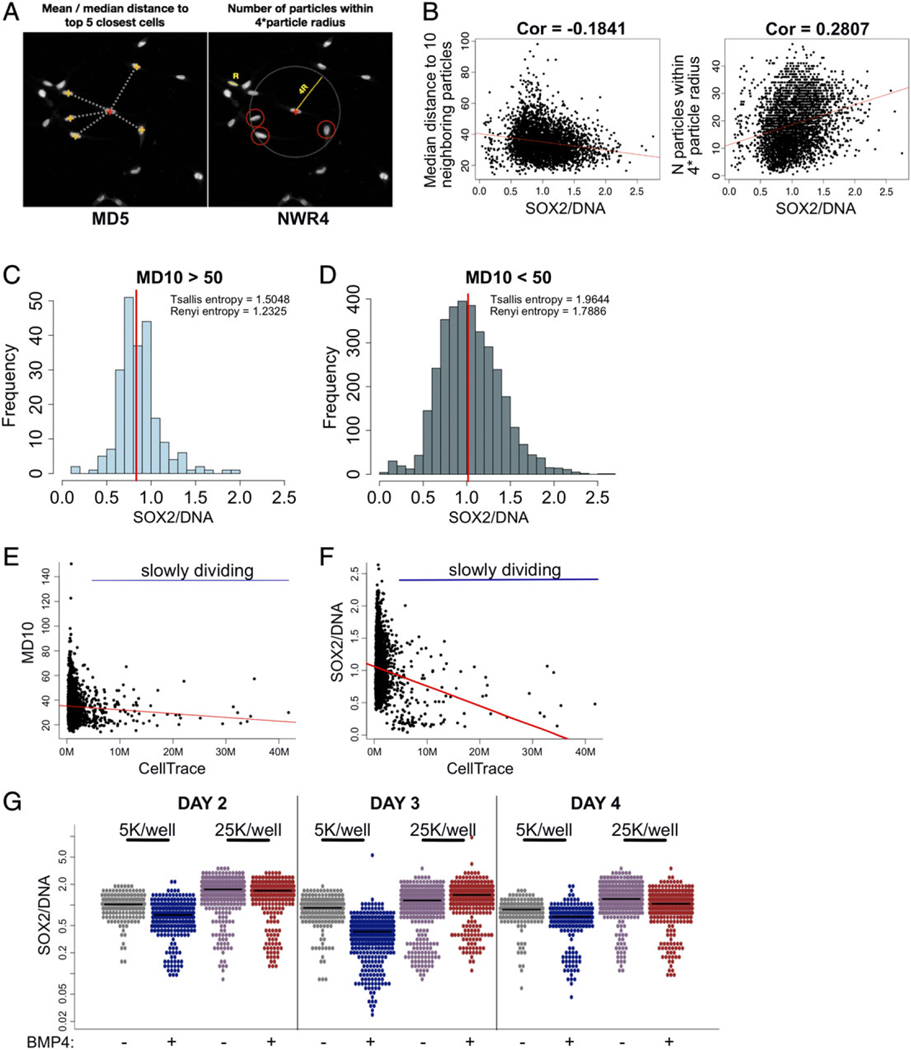
Figure 4.
Local cell density correlates with diversity of SOX2 expression and influences state transition. (A) Using particle coordinates HASCIA allows to quantify two spatial parameters: mean/median distance to top N neighboring particles (MDn) and number of particles within N× average particle radius (NWRn). (B) SOX2/DNA was plotted against MD10 and NWR4, which revealed significant correlation (Pearson’s test) between these parameters. Highest SOX2/DNA was observed in high-density areas. (C) Subset of CSC population in low local density (MD10 > 50) has a lower diversity (Tsallis and Renyi entropies) and slightly a lower average SOX2/DNA than (D) CSCs in high local density area (MD10 < 50). (E) 5-Day proliferation assay revealed slowly dividing cells (high retention of CellTrace dye) in high-density areas. (F) Slowly dividing population possesses lower SOX2/DNA level. (G) State transition time course of cells plated at 5,000/well and 25,000/well revealed faster response in low-density culture and higher, more stable SOX2/DNA level in high-density culture. [Color figure can be viewed at wileyonlinelibrary.com]

