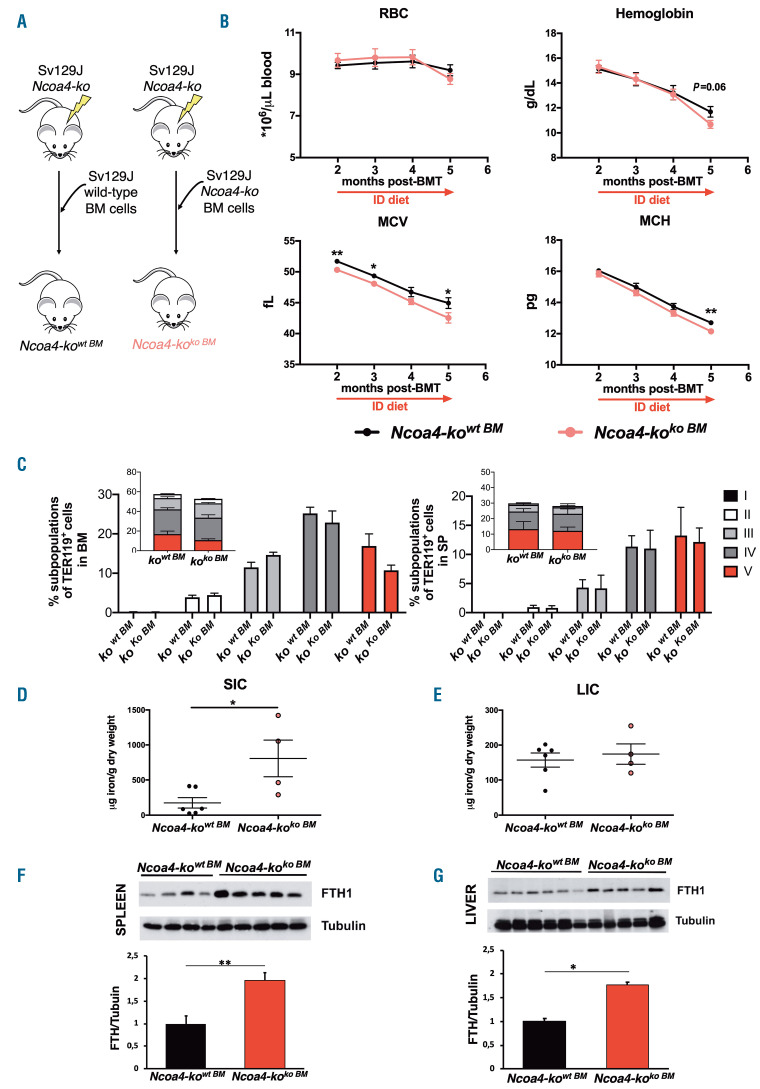
Figure 4.
Hematologic parameters, erythropoiesis and iron phenotype of Ncoa4-kowt BM and Ncoa4-koko BM mice fed an iron-poor diet. Ncoa4-ko mice on a Sv129/J background were transplanted with Sv129J wt (Ncoa4-kowt BM) or Ncoa4-ko (Ncoa4-koko BM) bone marrow (BM). Animals were fed an iron-deficient diet for 3 months starting 2 months after BM transplantation (BMT) and the complete blood count was determined periodically. (A) Scheme of the BMT procedure. (B) Red blood cell count, hemoglobin levels, mean corpuscular volume and mean corpuscular hemoglobin. (C) Percentage of Ter119+ cells on alive cells and subpopulation composition (determined as described in Figure 1B) both in the bone marrow and in the spleen of Ncoa4-kowt BM and Ncoa4-koko BMmice 5 months after BMT. The complete statistical analysis is reported in Online Supplementary Table S6. (D) Spleen iron content. (E) Liver iron content. (F, G) Ferritin H protein levels in the spleen (F) and liver (G) (representative western blot, upper panels and densitometric analysis, lower panels; tubulin used as a loading control) in Ncoa4-kowt BMand Ncoa4-koko BM mice 5 months after BMT. Mean values of four or five per genotype are shown. Error bars indicate the standard error. Asterisks refer to statistically significant differences between age-matched Ncoa4-kowt BM and Ncoa4- koko BM mice. *P<0.05; **P<0.01. RBC: red blood cells; MCV: mean corpuscular volume; MCH: mean corpuscular hemoglobin; SP: spleen; FTH: ferritin H.

