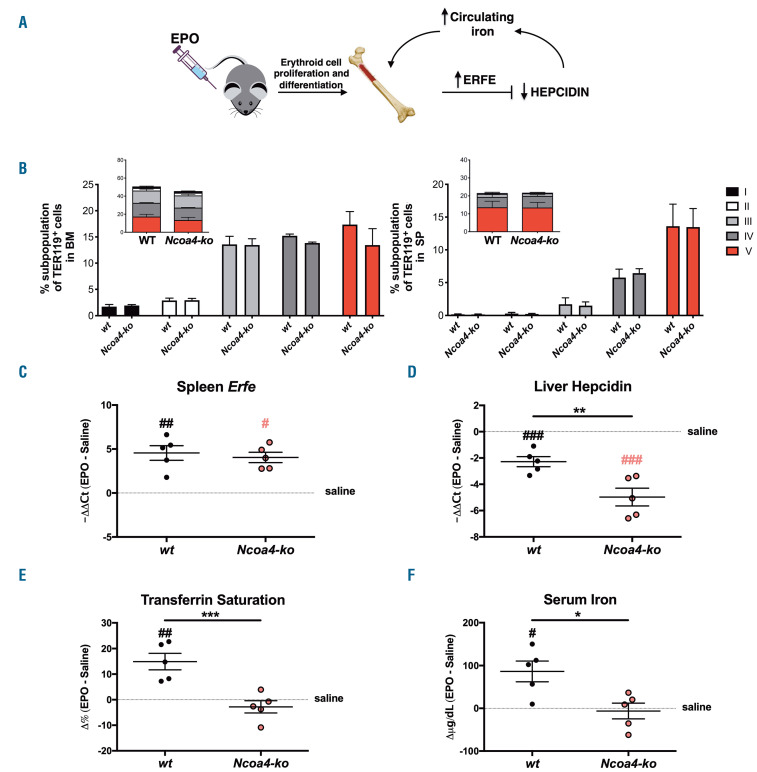
Figure 5.
Erythropoiesis and iron phenotype of wild-type and Ncoa4-ko mice after an acute erythropoietin challenge. Three-month old Ncoa4-ko and wild-type (wt) mice on a Sv129/J background were treated with a single intraperitoneal injection of erythropoietin (EPO; 8 IU/g) or saline as a control and sacrificed 15 h later. (A) A scheme of the expected alterations of iron homeostasis induced by the EPO injection. (B) The percentage of Ter119+ alive cells and subpopulation composition (determined as described in Figure 1B) both in the bone marrow and in the spleen of EPO-treated wt and Ncoa4-ko mice. The complete statistical analysis is reported in Online Supplementary Table S7. (C) Real-time polymerase chain reaction (PCR) of splenic erythroferrone (Erfe) to measure mRNA levels relative to those of glyceraldehyde 3-phosphate dehydrogenase (Gapdh). (D) Real-time PCR of hepatic hepcidin (Hamp) to measure mRNA levels relative to those of hypoxanthine phosphoribosyltransferase 1 (Hprt1). (E) Transferrin saturation. (F) Serum Iron levels. Data in (C-F) are expressed as the difference (Δ) between mice of the same genotype treated with EPO or saline (dotted gray line). Mean values of five animals per genotype are shown. Error bars indicate the standard error. Asterisks refer to statistically significant differences between age-matched EPO-treated wt and Ncoa4-ko mice. *P<0.05; **P<0.01; ***P<0.005. Hashtags refer to statistically significant differences between EPO- and saline-treated mice of the same genotype. #P<0.05; ##P<0.01; ###P<0.005. ERFE: erythroferrone; BM: bone marrow; SP: spleen.

