
Figure 2.
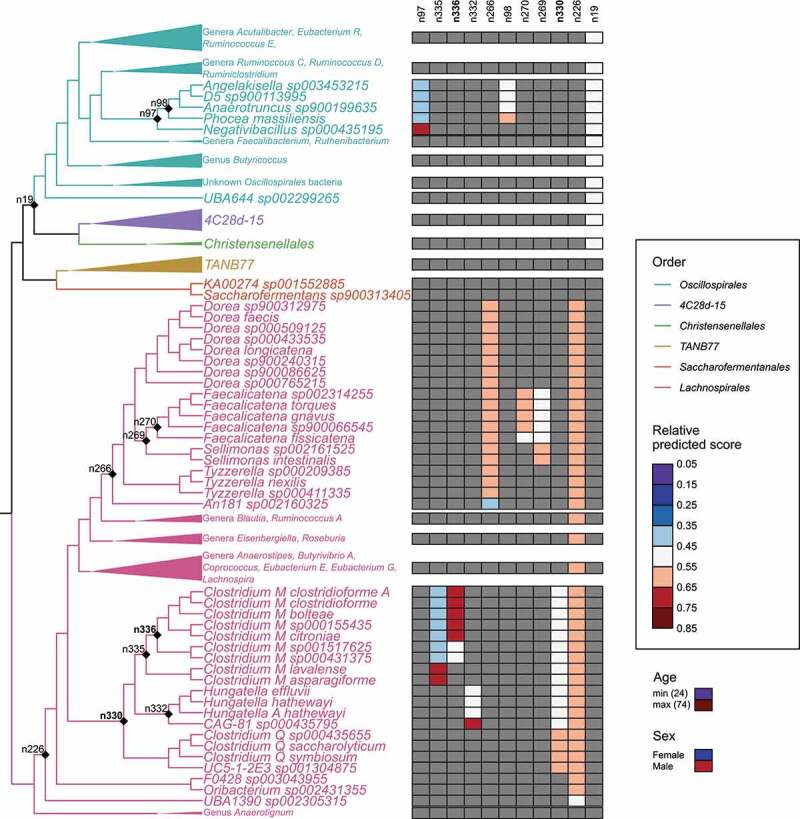
Relative effects of predictive balances and covariates on the FLI < 60 and FLI ≥ 60 classification model (AUC = 0.75) predictions. Nodes of the balances are indicated in the cladogram and the relative effect sizes of their clades (opposite sides of each balance) are shown in the associated heatmap. The relative effect sizes of the covariates (age and sex) are shown below the legend with a heatmap on the same scale as was used for the balances. The two liver-specific balances associated with triglyceride and GGT levels are indicated with bold font. Clades with redundant information have been collapsed but their major genera are indicated. The complete tree is included in Figure S8.