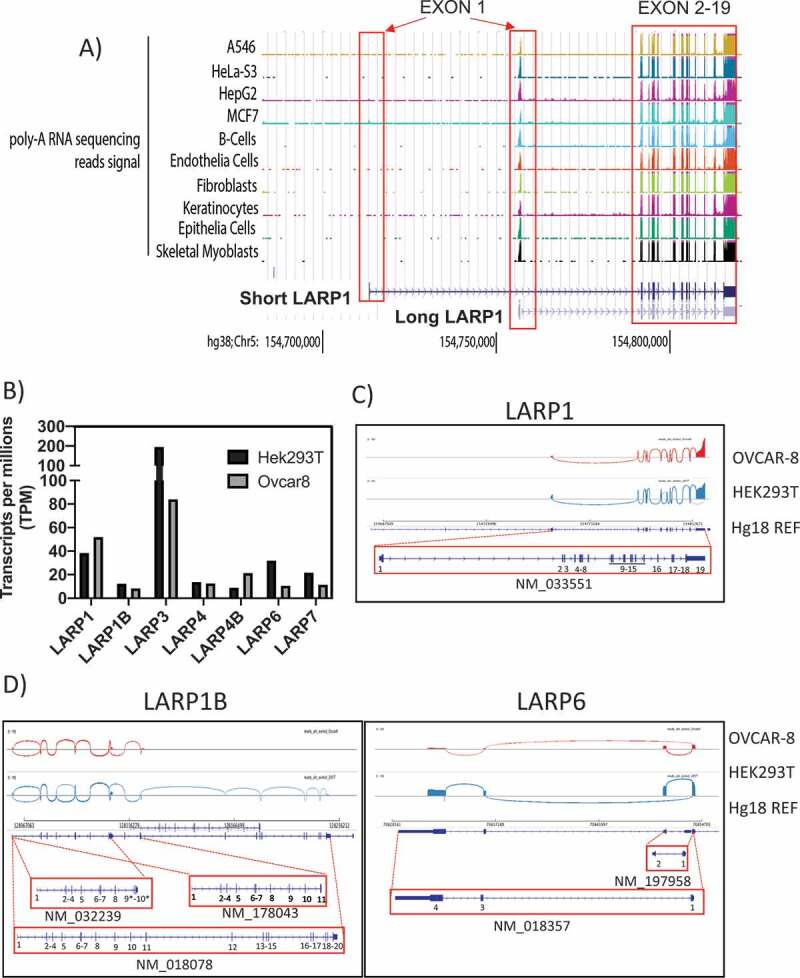
Figure 2.

Transcriptomic profile of LARP1 isoform expression
A) In silico analysis of expression levels of short and long LARP1 isoforms indicates a prevalent expression of the long isoform in primary cells, tissue and cancer cell lines. Data extracted from ENCODE database and visualized using UCSC Genome browser. Also, see Supporting Data 1 for a full list of analyzed data. B) Quantification of transcripts after direct RNA sequencing of OVCAR-8 and HEK-293 T cells by Nanopore Sequencing. C) Splice site selection of LARP1, D) LARP1B and LARP6 in OVCAR-8 and HEK-293 T cells. Sashimi plots are shown for most frequent splice site selections. A detection cut off of minimum of 2 exon-exon junction coverage was applied. The most frequently detected transcript variants are shown below the plot including the NCBI accession number. Also see Supporting Data 2.
