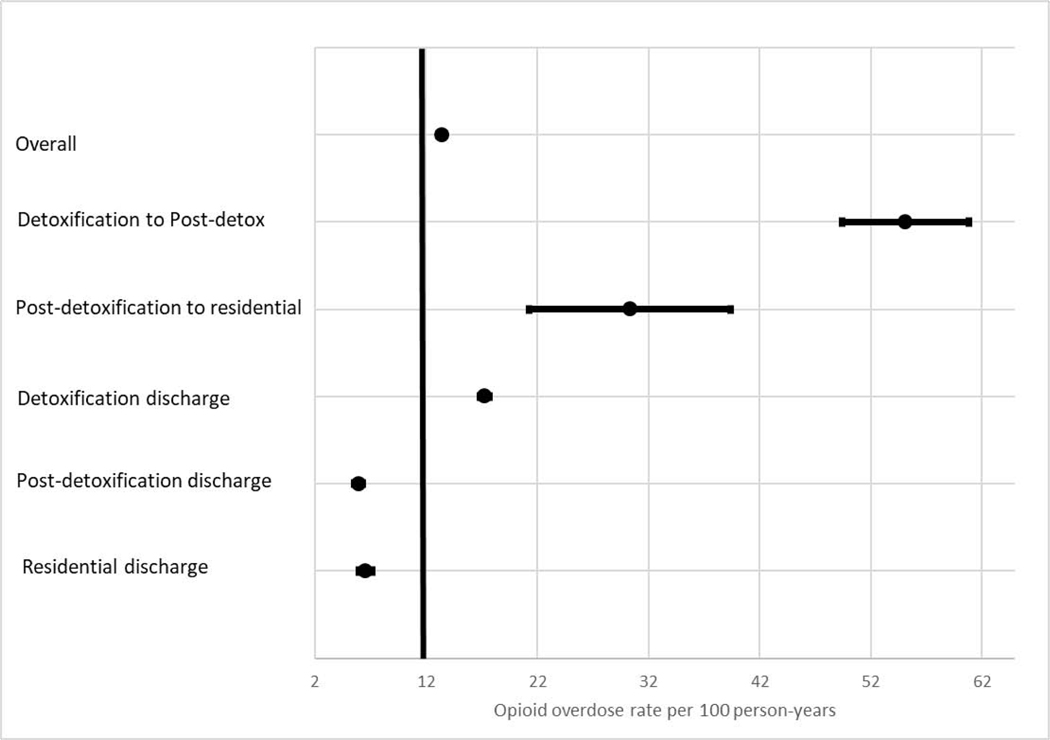
Figure 2: Opioid-related overdose during transitions between inpatient care stages.
Figure legend: Each point represents the rate of opioid-related overdose in the stage per 100 person-years, and the error bars represent the 95% confidence interval for each estimate. The vertical line through the overall rate provides a visual representation of how overdose rates in transition periods compare to the overall overdose rate.

