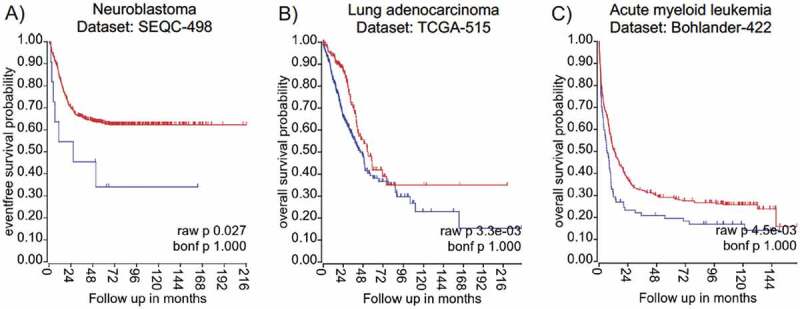
Figure 2.

Kaplan Meyer survival curves suggest elevated expression of hLa mRNA as indicator for poor cancer prognosis
The conclusion that high hLa mRNA expression correlates with low survival is drawn from: A) The neuroblastoma data set SEQC-498 consists of 498 cases including 487 patient samples with low (red) La and 11 with high (blue) La mRNA expression levels, leading to a significant difference (p = 0,027). B) The lung adenocarcinoma data set TCGA-515 consists of 515 cases including 187 patient sample with low (red) La and 328 with high (blue) La mRNA expression levels, leading to a significant difference (p = 0,0033). C) The acute myeloid leukaemia data set Bohlander-422 consists of 422 cases including 335 patient sample with low (red) La and 87 with high (blue) La mRNA expression levels, leading to a significant difference (p = 0,0045). Datasets and Kaplan Meier curves were derived from the R2Platform (https://r2.amc.nl). Red lines = low La mRNA expression; blue lines = high La mRNA expression.
