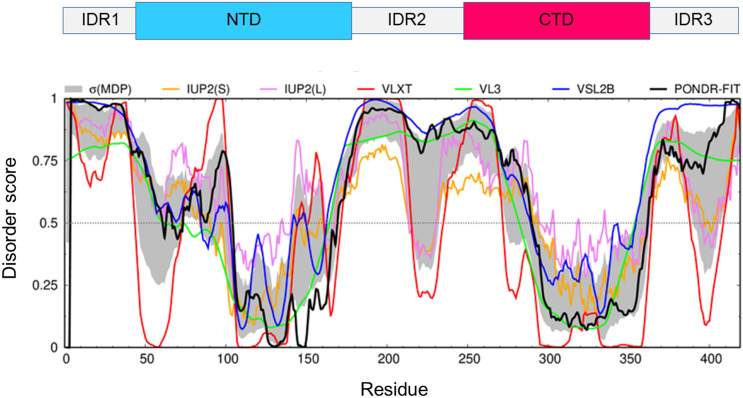
Fig. 1.
Bioinformatics analysis of the intrinsic disorder predisposition of the SARS-CoV-2 nucleocapsid N protein obtained using IUPred short (golden line), IUPred long (purple line), PONDR® VLXT (red line), PONDR® VL3 (green line), PONDR® VSL2B (blue line), PONDR® FIT (black line). The gray shadow region signifies the error distribution σ(MDP) around the mean disorder profile calculated by averaging of the disorder profiles of individual predictors. Protein regions with a disordered score consistently larger than 0.5 are considered disordered, whereas regions with disorder scores between 0.2 and 0.5 are considered as flexible. Over the plot, the domain organization used in the text is reported

