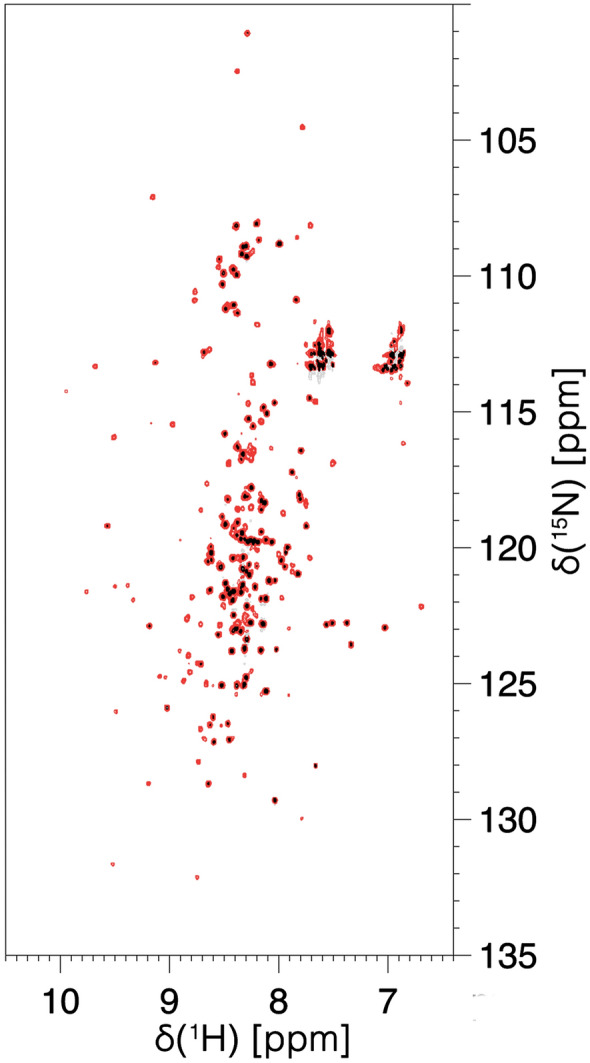
Fig. 2.

The 2D HN BEST-TROSY of IDR1-NTD-IDR2 construct of the SARS-CoV-2 nucleocapsid protein. The figure shows the superimposition of two different processing of the same spectrum: the black one is optimized for the resolution and the red one is optimized for the signal to noise ratio. The spectrum was collected on a 28.3 T Bruker AVANCE NEO spectrometer operating at 1200.85 MHz 1H, 301.97 MHz 13C, and 121.70 MHz 15N equipped with a 3 mm cryogenically cooled triple-resonance probehead (TCI)
